
What do science, culture, and policy have in common? In order to improve the quality and affordability of health care, all three have to change. This message is central to
Sage Bionetworks’ mission and the theme from this year’s
Sage Commons Congress held April 15th and 16th in San Francisco.
What’s the problem?
Biology is complex. This complexity makes it difficult to understand why some people are healthy and why others get sick. In some cases we have a clear understanding of the biochemical origins of health conditions and their treatments. Unfortunately, most drugs are
effective for only a fraction of the people they treat, and in the cases where drugs are effective, their effectiveness is diminished by side effects. The most striking problems being adverse events, which are the sixth leading cause of death in the US.
One way to cost effectively improve health care is to increase the efficacy of treatments in greater numbers of individuals. Also referred to as personalized medicine, the idea is that future treatments are accompanied by diagnostic tests that indicate the treatment's effectiveness. Accomplishing this goal requires that we understand the ways in which drugs affect their specific and non-specific targets with much higher precision. We also need to understand each target’s role in its biological pathway. However, as we attempt to break systems down into pathways and their component parts, a problem emerges. The components participate in multiple pathways and pathways interact with other pathways to form higher-ordered networks, and these interactions vary within individuals.
 |
| LinkedIn or Biology? |
When visualized, biological networks look a lot like LinkedIn, Facebook, or Twitter networks. In these social networks, individuals participate in many groups and have connections to one another. Unlike social networks, which are easy to dissect, our biological networks comprise millions of interactions between proteins, DNA, RNA, chemicals, and microorganisms. Studying these networks requires advanced data collection technologies, computer programs, software systems,
and social interactions. Therein lies the rub.
More data isn't enough
Turning the vision of personalized therapies into reality requires a large numbers of scientists who understand the power of global analyses and can work together in research communities. Hence, one part of the Sage mission is to get greater numbers of scientists to adopt new approaches. Another part is getting them to share their data in useful ways.
Accomplishing this goal requires changing the research culture from one that emphasizes individual contributions to one that promotes group participation. Our publish or perish paradigm, combined with publication business models, discourages open-access and data sharing. It also reduces innovation. According to data presented by
Aled Edwards, when faced with the opportunity to look at something completely new, we focus on well-known research problems. Why? Because funding is conservative and doing the same thing as your peers has less risk.
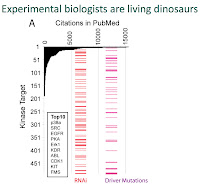 |
| From Edwards' Presentation |
Bottom line, we need to take more risk in our research and take more risk sharing data pre and post publication. Taking more risk means we need to trust each other more.
Simply increasing data availability, however, is not enough. We also need to change health care policy.
Vicki Seyfert-Margolis (Senior Advisor, Science Innovation and Policy Office of the FDA) gave a presentation (of her views) that helped explain why research expenditures are increasing while the drug pipeline is getting smaller. She described the medical product ecosystem as a large community of individuals from academia, biotech/pharma, device/diagnostic companies, regulators, payors, physicians, and patients, and discussed how all parties need to be involved in changing their practices to improve outcomes. Seyfert-Margolis closed her presentation by focusing on the public’s (patients') role in changing health policy and how, through social media, the public can become more involved and influence direction.
Changing the world is hard
Sage’s mission is ambitious and audacious. Simultaneously tackling three major problems, as Sage is trying to do, has significant risk. So, what can they do to mitigate their risk and improve success? I’ll close by offering a couple of suggestions.
Education is needed - The numbers of researchers who understand the kinds of data that are needed and how to analyze those data and develop network models is small. Further, technology advances keep moving the target, and evaluating models requires additional bench research and others need to be convinced that this is worthwhile. Sage is on the right path by initiating the conversation, but more is needed to increase understanding and evaluating data. Creating a series of blog articles and tutorials would be good first steps. It would help if presentations focused less on final results and more on data collection and analysis processes.
Be Bold - Part of the congress included presentations about a federation experiment in which a group of labs collaborated by openly sharing their data with each other in real time. This is a good step forward, that would be great step forward if the collaboration ran as a publicly open project where anyone could join. Open it up! Success will be clear when a new group, who is unknown to the current community, forms and accomplishes interesting work with their own data and the commons data. A significant step forward, however, is the openness of the meeting itself as all slides and video recordings of the presentations are
available. Additionally,
twitter and other forms of realtime communication were encouraged.
In closing, I laud Steven Friend and Eric Schadt for founding Sage Bionetworks and pushing the conversation forward. For the past two years the Sage Commons Congress has brought together an amazing and diverse group of participants. The conversation is happening at a critical time because health care needs to change in so many ways. We are at an amazing conversion point with respect to science, technology, and software capabilities that the opportunity for having an impact is high. Geospiza is focused on many aspects of the mission, and we look forward to helping our customers work with their data in new ways. It’s been a pleasure to have the opportunity to participate and help advance progress.


