Showing posts with label RNA-seq. Show all posts

Sunday, May 12, 2013

Sneak Peek: Elucidating the Effects of the Deep Water Horizon Oil Spill on the Atlantic Oyster Using RNA-Sequencing Data Analysis Methods

Join us this Tuesday, May 21st at 10 AM Pacific Time / 1:00 PM Eastern Time, for an interesting webinar on the effects of the Deep Water Horizon oil spill.

Speakers:
Natalia G. Reyero, PhD. – Mississippi State University
N. Eric Olson, PhD. – PerkinElmer Sr Leader Product Development

The Deep Water Horizon oil spill exposed the commercially important Atlantic oyster to over 200 million gallons of spill-related contaminants. To study toxicity effects, we sequenced the RNA of oyster samples from before and after the spill. In this webinar, we will compare and contrast the different data analysis methodologies used to address the challenge of an organism lacking a well-annotated genome assembly. Furthermore, we will discuss how the newly generated information provided insight into underlying biological effects of oil and dispersants on Atlantic oysters during the Deep Water Horizon oil spill.

REGISTER HERE to attend.

Wednesday, April 6, 2011

Sneak Peak: RNA-Sequencing Applications in Cancer Research: From fastq to differential gene expression, splicing and mutational analysis

Join us next Tuesday, April 12 at 10:00 am PST for a webinar focused on RNA-Seq applications in breast cancer research.

The field of cancer genomics is advancing quickly. News reports from the annual American Association of Cancer Research meeting are indicating that whole genome sequencing studies such as the 50 breast cancer genomes (WashU) are providing more clues about the genes that may be affected in cancer. Meanwhile, the ACLU/Myriad Genetics legal action over genetic testing for breast cancer mutations and disease predisposition continues to move towards the supreme court.

Breast cancer, like many other cancers, is complex.  Sequencing genomes is one way to interrogate cancer biology. However, the genome sequence data in isolation does not tell the complete story. The RNA, representing expressed genes, their isoforms, and non-coding RNA molecules, needs to be measured too. In this webinar, Eric Olson, Geospiza's VP of product development and principal designer of GeneSifter Analysis Edition, will explore the RNA world of breast cancer and present how you can explore existing data to develop new insights.

Abstract
Next Generation Sequencing applications allow biomedical researchers to examine the expression of tens of thousands of genes at once, giving researchers the opportunity to examine expression across entire genomes. RNA Sequencing applications such as Tag Profiling, Small RNA and Whole Transcriptome Analysis can identify and characterize both known and novel transcripts, splice junctions and non-coding RNAs. These sequencing based-applications also allow for the examination of nucleotide variant. Next Generation Sequencing and these RNA applications allow researchers to examine the cancer transcriptome at an unprecedented level. This presentation will provide an overview of the gene expression data analysis process for these applications with an emphasis on identification of differentially expressed genes, identification of novel transcripts and characterization of alternative splicing as well as variant analysis and small RNA expression. Using data drawn from the GEO data repository and the Short Read Archive, NGS Tag Profiling, Small RNA and NGS Whole Transcriptome Analysis data will be examined in Breast Cancer.

You can register at the webex site, or view the slides after the presentation.

Thursday, March 10, 2011

Sneak Peak: The Next Generation Challenge: Developing Clinical Insights Through Data Integration

Next week (March 14-18, 2011) is CHI's X-Gen Congress & Expo. I'll be there presenting a poster on the next challenge in bioinformatics, also known as the information bottleneck.

You can follow the tweet by tweet action via @finchtalk or #XGenCongress.

In the meantime, enjoy the poster abstract.

The next generation challenge: developing clinical insights through data integration

Next generation DNA sequencing (NGS) technologies hold great promise as tools for building a new understanding of health and disease. In the case of understanding cancer, deep sequencing provides more sensitive ways to detect the germline and somatic mutations that cause different types of cancer as well as identify new mutations within small subpopulations of tumor cells that can be prognostic indicators of tumor growth or drug resistance. Intense vendor competition amongst NGS platform and service providers are commoditizing data collection costs making data more assessable. However, the single greatest impediment to developing relevant clinical information from these data is the lack of systems that create easy access to the immense bioinformatics and IT infrastructures needed for researchers to work with the data. 

In the case of variant analysis, such systems will need to process very large datasets, and accurately predict common, rare, and de novo levels of variation. Genetic variation must be presented in an annotation-rich, biological context to determine the clinical utility, frequency, and putative biological impact. Software systems used for this work must integrate data from many samples together with resources ranging from core analysis algorithms to application specific datasets to annotations, all woven into computational systems with interactive user interfaces (UIs). Such end-to-end systems currently do not exist, but the parts are emerging. 

Geospiza is improving how researchers understand their data in terms of its biological context, function and potential clinical utility, by develop methods that combine assay results from many samples with existing data and information resources from dbSNP, 1000 Genomes, cancer genome databases, GEO, SRA and others. Through this work, and follow on product development, we will produce integrated sensitive assay systems that harness NGS for identifying very low (1:1000) levels of changes between DNA sequences to detect cancerous mutations, emerging drug resistance, and early-stage signaling cascades.

Authors: Todd M. Smith(1), Christoper Mason(2) 
(1). Geospiza Inc. Seattle WA 98119, USA. 
(2). Weil Cornell Medical College, NY NY 10021, USA

Thursday, October 28, 2010

Bloginar: Making cancer transcriptome sequencing assays practical for the research and clinical scientist

A few weeks back we (Geospiza and Mayo Clinic) presented a research poster at BioMed Central’s Beyond the Genome conference. The objective was to present GeneSifter’s analysis capabilities and discuss the practical issues scientists face when using Next Generation DNA Sequencing (NGS) technologies to conduct clinically orientated research related to human heath and disease.

Abstract
NGS technologies are increasing in their appeal for studying cancer. Fully characterizing the more than 10,000 types and subtypes of cancer to develop biomarkers that can be used to clinically define tumors and target specific treatments requires large studies that examine specific tumors in 1000s of patients. This goal will fail without significantly reducing both data production and analysis costs so that the vast majority of cancer biologists and clinicians can conduct NGS assays and analyze their data in routine ways.

While sequencing costs are now inexpensive enough for small groups and individuals, beyond genome centers, to conduct the needed studies, the current data analysis methods need to move from large bioinformatics team approaches to automated methods that employ established tools in scalable and adaptable systems to provide standard reports and make results available for interactive exploration by biologists and clinicians. Mature software systems and cloud computing strategies can achieve this goal.

Poster Layo
ut
Excluding the title, the poster has five major sections. The first section includes the abstract (above) and study parameters. In the work, we examined the RNA from 24 head and neck cancer biopsies from 12 individuals' tumor and normal cells.

The remaining sections (2-5), provide a background of NGS challenges, applications, high-level data analysis workflows, the analysis pipeline used in the work, the comparative analyses that need to be conducted, and practical considerations for groups seeking to do similar work. Much of section 2 has been covered in previous blogs and research papers.

Section 3: Secondary Analysis Explores Single Samples
NGS challenges are best known for the amount of data produced by the instruments. While this challenge should not be undervalued, it is over discussed. A far greater challenge lies in the complexity of data analysis. Once the first step (primary analysis, or basecalling) is complete, the resulting millions of reads must be aligned to several collections of reference sequences. For human RNA samples, these include the human genome, splice junction databases, and others to measure biological processes and filter out reads arising from artifacts related to sample preparation. Aligned data are further processed to create tables that annotate individual reads and compute quantitative values related to how the sample’s reads align (or cover) regions of the genome or span exon boundaries. If the assay measures sequence variation, alignments must be further processed to create variant tables.

Secondary analysis produces a collection of data in forms that can be immediately examined to understand overall sample quality and characteristics. High-level summaries indicate how many reads align to things we are interested in and not interested in. In GeneSifter, these summaries are linked to additional reports that show additional detail. Gene List reports, for example, show how the sample reads align within a gene’s boundary. Pictures in these reports are linked to Genesifter's Gene Viewer reports that provide even greater detail about the data with respect to each read’s alignment orientation and observed variation.

An important point about secondary analysis, however, is that it focuses on single sample analyses. As more samples are added to the project, the data from each sample must be processed through an assay specific pipeline. This point is often missed in the NGS data analysis discussion. Moreover, systems supporting this work must not only automate 100s of secondary analysis steps, they must also provide tools to organize the input and output data in project-based ways for comparative analysis.

Section 4: Tertiary Analysis in GeneSifter Compares Data Between Samples
The science happens in NGS when data are compared between samples in statistically rigorous ways. RNA sequencing makes it possible to compare gene expression, exon expression, and sequence variation between samples to identify differentially expressed genes, their isoforms, and whether certain alleles are differentially expressed. Additional insights are gained when gene lists can be examined in pathways and by ontologies. GeneSifter performs these activities in a user-friendly web-environment.

The poster's examples show how gene expression can be globally analyzed for all 24 samples, how a splicing index can distinguish gene isoforms occurring in tumor, but not normal cells, and how sequence variation can be viewed across all samples. Principal component analysis shows that genes in tumor cells are differentially expressed relative to normal cells. Genes highly expressed in tumor cells include those related to cell cycle and other pathways associated with unregulated cell growth. While these observations are not novel, they do confirm our expectations about the samples and being able to make such an observation with just a few clicks prevents working on costly misleading observations. For genes showing differential exon expression, GeneSifter provides ways to identify those genes and navigate to the alignment details. Similarly reports that show differential variation between samples can be filtered by multiple criteria in reports that link to additional annotation details and read alignments.

Section 5: Practical Considerations
Complete NGS data analysis systems seamlessly integrate secondary and tertiary analysis. Presently, no other systems are as complete as GeneSifter. There are several reasons why this is the case. First, a significant amount of software must be produced and tested to create such a system. From complex data processing automation, to advanced data queries, to user interfaces that provide interactive visualizations and easy data access, to security, software systems must employ advanced technologies and take years to develop with experienced teams. Second, meeting NGS data processing requirements demands that computer systems be designed with distributable architectures that can support cloud environments in local and hosted configurations. Finally, scientific data systems must support both predefined and ad hoc query capabilities. The scale of NGS applications means that non-traditional approaches must be used to develop data persistence layers that can support a variety of data access methods and, for bioinformatics, this is a new problem.

Because Geospiza has been doing this kind of work for over a decade and could see the coming challenges, we’ve focused our research and development in the right ways to deliver a feature rich product that truly enables researchers to do high quality science with NGS.

Enjoy the poster.

Wednesday, September 29, 2010

A Genomics Genealogy

Deep sequencing technologies have radically changed how we study biology. Deciding what technology and software to use can be daunting. Choices become easier when the relationships between different DNA sequencing applications are understood.


A brief history 

DNA sequencing grew from our desire to understand how the instructions for the biochemistry of life are encoded in an organism’s DNA. If we know the precise ordering and organization of an organism’s DNA sequence, we can presumably unlock a code that reveals these instructions. Accomplishing this goal required the creation of a new field, molecular biology, and new technologies to sequence genes.

The first sequencing methods were arduous. They combined nuclease digestion with thin layer chromatography to measure di- and trinucleotides that could be puzzled together. Later, Maxim and Gilbert replaced enzymatic DNA degradation with a chemical fragmentation method that enabled the reading of ordered bases from 32P labeled fragments separated by electrophoresis.

The Sanger method, which used dideoxynucleotide triphosphates to create ensembles of DNA molecules terminated at each base, soon replaced Maxim Gilbert sequencing. The next innovation was to color code DNA with fluorescent dyes so that molecules could be interrogated with a laser and camera coupled to a computer. This innovation automated “high-throughput” DNA sequencing systems, initially with polyacrylamide gels and later with capillary electrophoresis, and made it possible to sequence the human and other genomes. It also created the first transcriptome analysis method, Expressed Tag Sequencing (EST).

Despite 20 years of advances, however, the high-throughput sequencing methods were not high-enough-throughput to realistically interrogate DNA and RNA molecules in creative ways. Big questions (genomes, ESTs, meta-genomes) required large factory-like approaches to automate sample preparation and collect sequences because a fundamental problem had yet to be solved. Specially, each sequence was obtained from an individual purified DNA clone or PCR product.

Real high-throughput is massively parallel throughput 

The next-generation DNA sequencing (NGS) technologies free researchers from the need to clone or purify every molecule. They all share the common innovation that DNA sequencing is performed in a massively parallel format. That is a library, or ensemble of millions of DNA molecules, are simultaneously sequenced. Data collection costs are dramatically decreased through miniaturization and by eliminating the need for warehouses of colony pickers, prep robots, sequencing instruments, and large teams of people.

The new problem is dealing with the data that are produced and increasing computation costs. As NGS opens new possibilities to measure DNA and RNA in novel ways, each application requires a specific laboratory procedure that must be coupled to a specific analysis methodology.

Sequencing genealogy is defined by the questions 

In an evolutionary model, the history of cloning, restriction site mapping, and Sanger sequencing form the trunk of the genomics application tree (top figure) from which branches develop as new applications emerge.

NGS has driven the evolution of three main sequencing branches: De Novo, Functional Genomics, and Variation Assays. The De Novo, or Exploratory, sequencing contains three subbranches that include new genomes (projects that seek to determine a complete genome sequence of an organism), meta-genomes (projects in which DNA fragments are sequenced from environmental samples), or meta-transcriptomes (projects where cDNA fragments are sequenced from environmental samples).


The Functional Genomics branch is growing fast. In these experiments, different collections of RNA or DNA molecules from an organism, tissue, or cells, are isolated and sequenced to measure gene expression and how it is regulated. Three subbranches describe the different kinds of function genomics: Expression, Regulation, and EpiGenomics, and each of these subbranches can be further divided into specific assay groups (DGE, RNA-Seq, small RNA, etc) that can be even further subdivided into specialized procedures (RNA-Seq with strandedness preserved) that are defined by laboratory protocols, kits, and instruments. When the experiments are refined and are made reproducible, they become assays.

Variation Assays form the third main branch of the tree. Genomic sequences are compared within and between populations to link genotype and phenotype. In special cases like cancer and immunology research, variation assays are used to observe changes within an organism’s somatic genomes over time. Today, variation, or resequencing, assays measure nucleotide and small insertions and deletions in whole genomes and exomes. If linked sequence strategies (mate-pairs, paired-ends) are used, larger structural changes including copy number variations can also be measured.

Why is this important?

As a software provider with both deep lab and analysis experience, we [Geospiza] are often asked questions about what instrument platform is the best or how our software stacks up against other available options. The answer, of course, depends on what you want to do. De Novo applications benefit from long reads offered by platforms like 454. Many of the assay-based applications demand ultra-deep sequencing with very high numbers of sequences (reads) as provided by the short-read platforms (Illumina, SOLiD). New single molecule sequencing platforms like PacBio's are targeting a wide rage of applications but have best been demonstrated, thus far, for long-read uses and novel methylation assays.

From an informatics perspective, the exploratory and assay-based branches have distinct software requirements. Exploratory applications require that reads be assembled into contigs that must be further ordered into scaffolds to get to the complete sequence. In meta-genomics or meta-transcriptomics applications, data are assembled to obtain gene sequences. These projects are further complicated by orthologous and paralogous sequences and highly expressed genes that over represent certain sequences. In these situations, specialized hardware or complex data reduction strategies are needed to make assembly practical. Once data are assembled, they are functionally annotated in a second computational phase using tools like BLAST.

Assay-based data analysis also has two distinct phases, but they are significantly different from De Novo sequencing. The first phase involves aligning (or mapping) reads to reference data sources and then reducing the aligned data into quantitative values. At least one reference is required and the better it is annotated the more informative the initial results will be. Alignment differs from assembly in that reads are separately compared to a reference rather than amongst themselves. Alignment processing capacity can be easily scaled with multiple inexpensive computers whereas assembly processing cannot.

The second phase of Assay-based sequencing is to produce a discrete output as defined by a diagnostic application, or compare the quantitative values computed from the alignments from several samples, obtained from different individuals and (or) treatments relative to controls. This phase requires statistical tools to normalize data, filter false positives and negatives, and measure differences. Assay-based applications become more informative when large numbers of samples and replicates are included in a study.

Connecting the dots 

While the sequencing applications can be grouped and summarized in different ways, they are also interrelated. For example, De Novo projects are open-ended and exploratory, but their end product, a well-annotated reference sequence, is the foundation for Functional Genomics and Variation applications. Variation analysis is only useful if we can assign function to specific genotypes. Functional assignments come, in part, from previous experiments and genomic annotations, but are increasingly being produced by sequencing assays, so the new challenge is integrating that data obtained from different assays into coherent datasets that can link many attributes to a set of genotypes.

NGS clearly opens new possibilities for studying and characterizing biological systems. Different applications require different sequencing platforms, laboratory procedures, and software systems that can organize analysis tools and automate data processing. On this last point, as one evaluates their projects and their options for being successful, they need to identify informatics groups that have deep experience, available solutions, and strong capabilities to meet the next challenges. Geospiza is one such group.

Further Reading

DNA Sequencing History

Gilbert W, Maxam A (1973) The nucleotide sequence of the lac operator. Proc Natl Acad Sci U S A 70:3581

Maxam AM, Gilbert W (1977) A new method for sequencing DNA. Proc Natl Acad Sci U S A 74:560

Sanger F, Nicklen S, Coulson AR (1977) DNA sequencing with chain-terminating inhibitors. Proc Natl Acad Sci U S A 74:5463-7

Smith LM, Sanders JZ, Kaiser RJ, Hughes P, Dodd C, Connell CR, Heiner C, Kent SB, Hood LE (1986) Fluorescence detection in automated DNA sequence analysis. Nature 321:674-9

Adams MD, Soares MB, Kerlavage AR, Fields C, Venter JC (1993) Rapid cdna sequencing (expressed sequence tags) from a directionally cloned human infant brain cdna library. Nat Genet 4:373-80

International Human Genome Sequencing Consortium, 2001. “Initial sequencing and analysis of the human genome.” Nature 409, 860-921.
Venter J.C., Adams M.D., Myers E.W., et. al. 2001. “The sequence of the human genome.” Science 291, 1304-1351.

FinchTalks

Tuesday, May 11, 2010

Journal Club: Decoding Biology

DNA sequences hold the information needed to create proteins and regulate their abundance. Genomics research focuses on deciphering the codes that control these processes by combining DNA sequences with data form assays that measure gene expression and protein interactions. The codes are deciphered when specific sequence elements (motifs) are identified and can be later used to predict outcomes. The recent Nature article “Deciphering the Splicing Code,” begins to reveal the codes of alternative splicing.

The genetic codes 

Since the discovery that DNA is a duplex molecule [1] which stores and replicates the information of living systems, the goal of modern biology has been to understand how the blueprint of a living system is encoded in its DNA. The first quest was to learn how DNA's four letter nucleotide code was translated into the 20 letter amino acid code of proteins. Experiments conducted in the 1960’s revealed that different combinations of triplet DNA bases encoded specific amino acids to produce the “universal” genetic code, which is nearly identical in all species that have been examined to date [2].

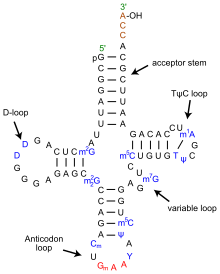
Translating mRNA into protein is a complex process, however, that involves many proteins and ribosomal RNA (rRNA) collectively organized in ribosomes. As the ribosomes read the mRNA sequence, transfer RNA (tRNA) molecules bring individual amino acids to the ribosome where they are added to a growing polypeptide chain. The universal genetic code explained how tri-nucleotide sequences specified amino acids. It could also be used to elucidate the anti-codon portion of tRNA [3], but it could not explain how the correct amino acid was added to the tRNA. For that another genetic code needed to be cracked. In this code, first proposed in 1988 [4], multiple sequences, including the anti-codon loop, within each tRNA molecule are recognized by a matched enzyme that combines an amino acid with its appropriate tRNA.

Codes to create diversity

The above codes are involved with the process of translating genetic sequences into protein. Most eukaryotic genes, and a few prokaryotic genes, cannot be translated in a continuous way because the protein coding regions (exons) are interrupted by non-coding regions (introns). When DNA is first transcribed into RNA, all regions are included and the introns must be excised to form the final messenger RNA (mRNA). This process makes it possible to create many different proteins from a single gene through alternative splicing in which exons are either differentially removed or portions of exons are joined together. Alternative splicing occurs in development and tissue specific ways; many disease causing mutations disrupt splicing patterns. So, understanding the codes that control splicing is an important research topic.

Some of the splicing codes, such as the exon boundaries, are well known, and others are not. In “Deciphering the Splicing Code,” Barash and colleagues looked at thousands of alternatively spliced exons - and surrounding intron sequences - from 27 mouse tissues to unravel over 1000 sequence features that could define a new genetic code. Their goal is build catalogs of motifs that could be used to predict splicing patterns of uncharacterized exons and determine how mutations might affect splicing.

Using data from existing microarray experiments, RNA sequence features compiled from the literature, and other known attributes of RNA structure, Barash and co-workers developed computer models to determine which combinations of features best correlated with experimental observations. The resulting computer program provided tissue specific splicing predictions of whether an exon would be included or excluded based on its surrounding motif sequences and tissue type with reasonable success. More importantly, the program could be used to identify interaction networks that identified pairs of motifs that were frequently observed together. 

Predicting alternative splicing is at an early stage, but as pointed out be the editorial summary, the approach of Barash and co-workers will be improved by the massive amounts of data being generated by new sequencing technologies and applications like RNA-Seq and various protein binding assays. The real test will be expanding the models to new tissues and human genomics. In the meantime, if you want to test their models on some of your data or explore new regulatory elements, the Frey lab has developed a web tool that can be accessed at http://genes.toronto.edu/wasp/.

I’m done with seconds, can I have a third? 

As an aside, the authors of the editorial summary coined the work as the second genetic code. I find this amusing, because this would be the third second genetic code. The aminoacyl tRNA code was also coined the second genetic code, but people must have forgotten that, because another second genetic code was proposed in 2001. This genetic code describes how methylated DNA sequences regulate chromatin structure and gene regulation. Rather than have a third second genetic code, maybe we should refer to this as the third genetic code or the next generation code.

Further Reading


1. Watson JD, and Crick F (1953). "A structure for deoxyribose nucleic acid". Nature 171: 737–8.

2. http://en.wikipedia.org/wiki/Genetic_code

3. http://nobelprize.org/nobel_prizes/medicine/laureates/1968/holley-lecture.pdf

4. Hou YM, Schimmel P (1988) "A simple structural feature is a major determinant of the identity of a transfer RNA." Nature 333:140-5.

Thursday, April 22, 2010

Bloginar: RNA Deep Sequencing: Beyond Proof of Concept

RNA-Seq is a powerful method for measuring gene expression because you can use the deep sequence data to measure transcript abundance and also determine how transcripts are spliced and whether alleles of genes are expressed differentially.  

At this year’s ABRF (Association for Biomedical Research Facilities) conference, we presented a poster, using data from published study, to demonstrate how GeneSifter Analysis Edition (GSAE) can be used in next generation DNA sequencing (NGS) assays that seek to compare gene expression and alternative splicing between different tissues, conditions, or species.

The following map guides the presentation. The poster has a title and four main sections, which cover background information, introduction to the published work and data, ways to observe alternative splicing and global gene expression differences between samples, and ways to observe sex specific gene expression differences. The last section also identifies a mistake made by the authors.  


Section 1. The first section begins with the abstract and lists five specific challenges created by NGS: 1) high end computing infrastructures are needed to work with NGS data, 2) NGS data analysis involves complex multistep processes, 3) NGS data need to be compared to many reference databases, 4) the resulting datasets of alignments must be visualized in different ways, and 5) scientific knowledge is gained when several aligned datasets are compared. 

Next, we are reminded that NGS data are analyzed in three phases: primary analysis, secondary analysis and tertiary analysis. Primary analysis is the step that converts images to reads consisting of basecalls (or colors, or flowgrams), and quality values. In secondary analysis, reads are aligned to reference data (mapped) or amongst themselves (assembled). Secondary analysis produces tables of alignments that must be compared to one and other, in tertiary analysis, to gain scientific insights. 

Finally, GSAE is introduced as a platform for scalable data analysis. GSAE’s key features and advantages are listed along with several screen shots to show the many ways in which analyzed data can be presented to gain scientific insights.  

Section 2 introduces the RNA-Seq data used for the presentation. These data, from a study that set out to measure sex and lineage specific alternative splicing in primates [1], were obtained from the Gene Expression Omnibus (GEO) database at NCBI, transferred into GSAE, and processed through GSAE’s RNA-Seq analysis pipelines.  We chose this study because it models a proper expression analysis using replicated samples to compare different cases.

All steps of the process, from loading the data to processing the files and viewing results were executed through GSAE’s web-based interfaces. The four general steps of the process are outlined in the box labeled “Steps.” 

The section ends with screen shots from GSAE showing how the primary data can be viewed and a list of the reports showing different alignment results for each sample in the list. The reports are accessed from a “Navigation Panel” that contains links to Alignment Summaries, a Filter Report, and a Searchable Sortable Gene List (shown), and several other reports (not shown). 

The Alignment Summary provides information about the numbers of reads mapping to different reference data sources that are used in the analysis to understand sample quality and study biology. For example, in RNA-Seq, it is important to measure and filter reads matching ribosomal RNA (rRNA) because the amount of rRNA present indicates how well clean up procedures work. Similarly, the number of reads matching adaptors indicates how well the library was prepared. Biological, or discovery based, filters include reads matching novel exon junctions and intergenic regions of the genome.

Other reports like the Filter Report and Gene List provide additional detail. The Filter Report clusters alignments and plots base coverage (read density) across genomic regions. Some regions, like mitochondrial DNA, and rRNA genes, or transcripts, are annotated. Others are not. These regions can be used to identify areas of novel transcription activity.

The Gene List provides the most detail and gives a comprehensive overview of the number of reads matching a gene, numbers of normalized reads, and the counts of novel splices, single nucleotide variants (SNVs), and small insertions and deletions (indels). Read densities are plotted as small graphs to reveal each gene’s exon/intron structure. Additional columns provide the gene’s name, chromosome, and contain links to further details in Entrez. The graphs are linked to the Integrated Gene Viewer to explore the data further. Finally, the Gene LIst is an interactive report that can searched, sorted, and filtered in different ways, so you can easily view the details of your gene or chromosome of interest.

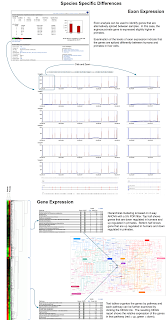
Section 3 shows how GSAE can be used to measure global gene expression and examine the details for a gene that is differentially expressed between samples. In the case of RNA-Seq, or exon arrays, relative exon levels can be measured to observe genes that are spliced differently between samples. The presented example focuses on the arginosuccinate synthetase 1 (ASS1) gene and compares the expression levels of its transcripts and exons between the six replicated human and primate male samples.

The Gene Summary report shows that ASS1 is down regulated by 1.38 times in the human samples. More interestingly, the exon usage plot shows that this gene is differentially spliced between the species. Read alignment data, supporting this observation, are viewed by clicking the “View Exon Data” link that is below the Exon Usage heat map. This link brings up the Integrated Gene Viewer (IGV) for all six samples. In addition to showing read densities across the gene, IGV also shows the numbers of reads that span exon junctions as loops with heights proportional to the number of reads mapping to a given junction. In these plots we see that the human samples are missing the second exon whereas the primate samples show two forms of the transcript. IGV also includes the Entrez annotations and known isoforms for the gene and the positions of known SNPs from dbSNP.  And, IGV is interactive; controls at the top of the report and regions within the gene map windows are used to navigate to new locations and zoom in or out of the data presented.  When multiple genes are compared, the data are updated for all genes simultaneously. 

Section 3 closes with heat map representing global gene expression for the samples being compared. Expression data are clustered using a 2-way ANOVA with 5% false discovery filter (FDR). The top half of the hierarchical cluster groups genes that are down regulated in humans and up regulated in primates and the bottom half groups genes that are expressed in the opposite fashion. The differentially expressed genes can also be viewed in Pathway Reports which show how many genes are up or down regulated in a particular Gene Ontology (GO) pathway.  Links in these reports navigate to lists of the individual genes or their KEGG pathways.  When a KEGG pathway is displayed, the genes that are differentially expressed are highlighted.
Section 4 focuses on the sex specific differences in gene expression between the human and primate samples. In this example, 12 samples are being compared: three replicates for the male and female samples of two species. When these data were reanalyzed in GSAE, we were able to note that an obvious mistake. By examining Y chromosome gene expression, it was clear that one of the human male samples (M2-2) was lacking expression of these genes. Similarly, when the X (inactive)-specific transcript (XIST) was examined, M2-2 showed high expression like the other female samples. The simplest explanations for these observations are that either M2-2 is a female, or a dataset was copied and mislabeled in GEO. However, given that the 12 datasets show subtle differences, it is likely that they are all different and the first explanation is more likely. 

The poster closes with a sidebar showing how GSAE can be used to measure global sequence variation and the take home points for the presentation. The most significant being that if the authors of the paper had used a system like GSAE, they could have quickly observed the problems in their data that we saw and prevented a mistake. 

To see how you can use GSAE for your data sign up for a trial

1. Sex-specific and lineage-specific alternative splicing in primates. Blekhman R, Marioni JC, Zumbo P, Stephens M, Gilad Y,. Genome Res. published online December 15, 2009

Wednesday, February 3, 2010

Sneak Peak: Data Analysis Methods for Whole Transcriptome Sequencing Applications – Challenges and Solutions

RNA sequencing is one of the most popular Next Generation Sequencing (NGS) applications. Next Thursday, February 11 at 10:00 A.M. PDT (1:00 P.M. EDT), we kick off our 2010 webinar series with a presentation designed to help you understand whole transcriptome data analysis and what can be learned in these experiments. In addition, we will show off some of our latest tools and interfaces that can be used to discover new RNAs, new splice forms of transcripts, and alleles of expressed genes.

Summary

RNA sequencing applications such as Whole Transcriptome Analysis, Tag Profiling and Small RNA Analysis allow whole genome analysis of coding as well as non-coding RNA at an unprecedented level. Current technologies allow for the generation of 500 million data points in a single instrument run. In addition to allowing for the complete characterization of all known RNAs in a sample (gene level expression summaries, exon usage, splice junction, single nucleotide variants, insertions and deletions), these applications are also ideal for the identification of novel RNAs as well as novel splicing events.

This presentation will provide an overview of Whole Transcriptome data analysis workflows with emphasis on calculating gene and exon level expression values as well as identifying splice junctions and variants from short read data. Comparisons of multiple groups to identify differential gene expression as well as differential splicing will also be discussed. Using data drawn from the GEO data repository and Short Read Archive (SRA), analysis examples will be presented for both Illumina’s GA and Lifetech’s SOLiD instruments.

Register Today!

Wednesday, September 23, 2009

GeneSifter in Current Protocols

This month we are pleased to report Geospiza's publication of the first standard protocols for analyzing Next Generation Sequencing (NGS) data. The pulication, appearing in the September issue of Current Protocols, addresses how to analyze data from both microarray, and NGS experiments. The abstract and links to the paper and our press release are provided below.

Abstract

Transcription profiling with microarrays has become a standard procedure for comparing the levels of gene expression between pairs of samples, or multiple samples following different experimental treatments. New technologies, collectively known as next-generation DNA sequencing methods, are also starting to be used for transcriptome analysis. These technologies, with their low background, large capacity for data collection, and dynamic range, provide a powerful and complementary tool to the assays that formerly relied on microarrays. In this chapter, we describe two protocols for working with microarray data from pairs of samples and samples treated with multiple conditions, and discuss alternative protocols for carrying out similar analyses with next-generation DNA sequencing data from two different instrument platforms (Illumina GA and Applied Biosystems SOLiD).

In the chapter we cover the following protocols:
  • Basic Protocol 1: Comparing Gene Expression from Paired Sample Data Obtained from Microarray Experiments
  • Alternate Protocol 1: Compare Gene Expression from Paired Samples Obtained from Transcriptome Profiling Assays by Next-Generation DNA Sequencing
  • Basic Protocol 2: Comparing Gene Expression from Microarray Experiments with Multiple Conditions
  • Alternate Protocol 2: Compare Gene Expression from Next-Generation DNA Sequencing Data Obtained from Multiple Conditions

Links

To view the abstract, contents, figures, and literature cited online visit: Curr. Protoc. Bioinform. 27:7.14.1-7.14.34

To view the press release visit: Geospiza Team Publishes First Standard Protocol for Next Gen Data Analysis

Saturday, September 12, 2009

Sneak Peak: Sequencing the Transcriptome: RNA Applications for Next Generation Sequencing

Join us this coming Wednesday, September 16, 2009 10:00 am Pacific Daylight Time (San Francisco, GMT-07:00), for a webinar on whole transcriptome analysis. In the presentation you will learn about how GeneSifter Analysis Edition can be used to identify novel RNAs and novel splice events within known RNAs.

Abstract:

Next Generation Sequencing applications such as RNA-Seq, Tag Profiling, Whole Transcriptome Sequencing and Small RNA Analysis allow whole genome analysis of coding as well as non-coding RNA at an unprecedented level. Current technologies allow for the generation of 200 million data points in a single instrument run. In addition to allowing for the complete characterization of all known RNAs in a sample, these applications are also ideal for the identification of novel RNAs and novel splicing events for known RNAs.

This presentation will provide an overview of the RNA applications using data from the NCBI's GEO database and Short Read Archive with an emphasis on converting raw data into biologically meaningful datasets. Data analysis examples will focus on methods for identifying differentially expressed genes, novel genes, differential splicing and 5’ and 3’ variation in miRNAs.

To register, please visit the event page.

Monday, June 22, 2009

Sneak Peak: RNA-Seq - Global Profiling of Gene Activity and Alternative Splicing

Join us June 30 at 10:00 am PDT. Eric Olson, Geospiza's VP of Product Development will present an interesting webinar on using RNA-Seq to measure gene expression and discover alternatively spliced messages using GeneSifter Analysis Edition.

Abstract

Next Generation Sequencing applications such as RNA-Seq, Tag Profiling and Small RNA Analysis allow whole genome analysis of coding as well as non-coding RNA at an unprecedented level. Current technologies allow for the generation of 200 million data points in a single instrument run. In addition to allowing for the complete characterization of all known RNAs in a sample, these applications are also ideal for the identification of novel RNAs and novel splicing events for known RNAs.

This presentation will provide an overview of the RNA-Seq data analysis process with emphasis on calculating gene and exon level expression values as well as identifying splice junctions from short read data. Comparisons of multiple groups to identify differential gene expression as well as differential splicing will also be discussed. Using data drawn from the GEO data repository and Short Read Archive (SRA), analysis examples will be presented for both Illumina’s GA and ABI’s SOLiD instruments.

To register visit the Geospiza webex event page.

Tuesday, April 21, 2009

What if dbEST was an NGS Experiment? Part I: dbEST

Back in 1997, this alarming statement appeared in a paper [1]:

“Biological research is generating data at an explosive rate. Nucleotide sequence databases along are growing at a rate of >210 million base pairs (bp)/year and it has been estimated that if the present rate of growth continues, by the end of the millennium the sequence databases will have grown to 4 billion bp!” [emphasis mine]

Imagine 4 billion bp of data - what would we do with all that?


The article was about the defunct Merck Gene Index browser, which was developed to make massive numbers of cDNA sequences, also called Expressed Sequence Tags (ESTs), available through a web-based system. The ESTs were being generated through the Merck Gene Index Project which was one of many public and private projects focused on collecting EST and full length cDNA sequences from human and model organism samples. The goal of these projects was to create data resources of transcript sequences for studying gene expression and later finding genes in genomic sequence data. Combined, these projects cost 10's of millions of dollars and spanned nearly a decade. They also produced millions of ESTs that are now stored in NCBI’s dbEST database [2].

And the prediction of GenBank’s growth was close, release 115 of GenBank (Dec, 1999) had 4.6 billion bases. With the most recent release, 9 years later, GenBank has grown to over 103 billion bases and some would say we are just getting started with sequencing DNA [3].

Today, for a few thousand dollars, a single run of an Illumina, SOLiD, or Helicos instrument can collect a greater amount of data than has ever been produced from all the EST projects combined. This begs the question, what would the data look like if dbEST was a Next Generation Sequencing (NGS) experiment?

A Brief History of dbEST

Before we get into comparing dbEST to a Next Generation DNA Sequencing (NGS) experiment, we should discuss what dbEST is and how it came to be. In the early days of automated DNA sequencing (ca. 1990) it was realized that cDNA, reverse transcribed from mRNA, could be partially sequenced and the resulting data could be used to measure which genes are expressed in a cell or tissue. The term EST was coined to describe the fact that each sequence corresponded to an mRNA molecule, and was in effect a “tag” for that molecule [4]. EST stands for Expressed Sequence Tag.

During the early years EST sequencing was controversial. Many proponents of the genome project felt that collecting ESTs would obviate the need for sequencing the entire genome and congress would end funding for the genome project before it was complete. Further controversy arose when NIH decided to patent several of the early brain ESTs. This news created an uproar in the community and led to the famous statement by one nobel laureate that automated sequencing machines “could be run by monkeys [5].”

ESTs also led to the founding of dbEST [2], a valuable resource for quickly assessing the functional aspects of the genome and later for identifying and annotating genes within genomic sequences. Today, EST projects continue to be worthwhile endeavors for exploring new organisms before full genome sequencing can be performed.

In the 15+ years since the founding of dbEST, the database has grown from 22,537 entries to approximately 61 million (4/17/2009). The first dbEST report contained ESTs from seven organisms. Today, over 1700 organisms are represented in dbEST. The species with the highest numbers of ESTs (> 1,000,000) include human, mouse, corn, pig, Arabidopsis, cow, zebrafish, soybean, Xenopus, rice, Ciona, wheat, and rat. More than half of the species however, have fewer than 10,000 ESTs. Since January of this year dbEST has grown by more than 2,000,000 entries.

Despite its value, dbEST, like many resources at the NCBI, requires an “expert” level of understanding to be useful. As classical clone-based cDNA sequencing gives way to more cost effective higher throughput methods like NGS, less emphasis will be placed on making this resource useful beyond maintaining the data as an archival resource that the community can access.

What this means is that when you visit the site, it does not look like much is there. You can get links to the original (closed access) papers and learn about how many sequences are present for each organism. Accession numbers, or gene names can used to look up a sequence and from other pages you can use BLAST to search the resource with a query sequence.

If you want to know more, you have to know how to look for the information and deal with it in the context in which it is presented. For example, I mentioned that dbEST has grown since January. I knew this because, I looked at the list of organisms and numbers of sequences then and now and noticed that more are reported now. However, to tell you where numbers have increased for which organisms, or whether new organisms have been added would require significant time and effort by either saving the different release reports or digging through the dbEST ftp site. When we return to the story, we’ll do some "ftp archealogy" and dig through dbEST records to begin characterizing the human ESTs.


References:

1. Eckman B.A., Aaronson J.S., Borkowski J.A., Bailey W.J., Elliston K.O., Williamson A.R., Blevins R.A., 1998. The Merck Gene Index browser: an extensible data integration system for gene finding, gene characterization and EST data mining. Bioinformatics 14, 2-13.

2. Boguski M.S., Lowe T.M., Tolstoshev C.M., 1993. dbEST--database for “expressed sequence tags”. Nat Genet 4, 332-333. See also: http://www.ncbi.nlm.nih.gov/dbEST/

3. ftp://ftp.ncbi.nih.gov/genbank/gbrel.txt

4. Adams M.D., Kelley J.M., Gocayne J.D., Dubnick M., Polymeropoulos M.H., Xiao H., Merril C.R., Wu A., Olde B., Moreno R.F., 1991. Complementary DNA sequencing: expressed sequence tags and human genome project. Science 252, 1651-1656.
And http://www.genomenewsnetwork.org/resources/timeline/1991_Venter.php

5. http://www.nature.com/nature/journal/v405/n6790/full/405983b0.html

Wednesday, March 4, 2009

Bloginar: The Next Generation Dilemma: Large Scale Data Analysis

Previous posts shared some the things we learned at the AGBT and ABRF meetings in early February. Now it is time to share the work we presented, starting with the AGBT poster, “The Next Generation Dilemma: Large Scale Data Analysis.”

The goal of the poster was to provide a general introduction to the power of Next Generation Sequencing (NGS) and a framework for data analysis. Hence, the abstract described the NGS general data analysis process; its issues and what we are doing for one kind of transcription profiling, RNA-Seq. Between then and now we learned a few things... And the project grew.

The map below guides my “bloginar” poster presentation. In keeping with the general theme of the abstract we focused on transcription analysis, but instead of focusing exclusively on RNA-Seq, the project expanded to compare three kinds of transcription profiling: RNA-Seq, Tag Profiling, and Small RNA Analysis. A link to the poster is provided at the end.

Section 1 provides a general introduction into NGS by discussing the ways NGS is being used to study different aspects of molecular biology. It also covers how the data are analyzed in thee phases (primary, secondary, tertiary) to convert raw data into biologically meaningful information. The three phase model has emerged as a common framework to describe the process of converting image data into primary sequence data (reads) and then turning the reads into information that be used in comparative analyses. Secondary analysis is the phase where reads are aligned to reference sequences to get gene names, position, and (or) frequency information that can be used to measure changes, like gene expression, between samples.

The remaining sections of the poster use examples from transcription analysis to illustrate and address the multiple challenges (listed below) that must be overcome to efficiently use NGS.
  • High end infrastructures are needed to manage and work with extremely large data sets
  • Complex, multistep analysis procedures are required to produce meaningful information
  • Multiple reference data are needed to annotate and verify data and sample quality
  • Datasets must be visualized in multiple ways
  • Numerous Internet resources must be used to fill in additional details
  • Multiple datasets must be comparatively analyzed to gain knowledge
Section 2 describes the three different kinds of transcription profiling experiments. This section provides additional background on the methods and what they measure. For example, RNA-Seq and Tag Profiling are commonly used to measure gene expression. In RNA-Seq, DNA libraries are prepared by randomly amplifying short regions of DNA from cDNA. The sequences that are produced will generally cover the entire region of the transcripts that were originally isolated. Hence, it is possible to get information about alternative splicing and biased allelic expression. In contrast, Tag Profiling focuses on creating DNA libraries from discrete points within the RNA molecules. With Tag Profiling, one can quickly measure relative gene expression, but cannot get information about alternative splicing and allelic expression. The table in section 2 discusses these and other issues one must consider when running the different assays.

Sections 3, 4, and 5 outline three transcriptome scenarios (RNA-Seq, Tag Profiling, and Small RNA, respectively) using real data examples (references provided in the poster). Each scenario follows a common workflow involving the preparation of DNA libraries from RNA samples, followed by secondary analysis, followed by tertiary analysis of the data in GeneSifter Analysis Edition.

For RNA-Seq, two datasets corresponding to mouse erythroid stem (ES) and body (EB) cells were investigated. DNA libraries were produced from each cell line. Sequences were collected from the library and compared to the RefSeq (NCBI) database according to the pipeline shown. The screen captures (middle of the panel) show how the individual reads map to each transcript along with the total numbers of hits summarized by chromosome. The process is repeated twice, once for each cell line, and the two sets of alignments are converted to Gene Lists for comparative analysis in GeneSifter laboratory edition to observe differential expression (bottom of the panel).

The Tag Profiling panel examines data from a recently published experiment (a reference is provided in the poster) in which gene expression was studied in transgenic mice. I’ll leave out the details of the paper, and only point out how this example shows the differences between Tag Profiling and RNA-Seq data. Because Tag Profiling collects data from specific 3’ sites in RNA, the aligned data (middle of the panel) show alignments as single “spikes” toward the 3’ end of transcripts. Occasionally multiple peaks are observed. The question being, are the additional peaks the result of isoforms (alternative polyA sites) or incomplete restriction enzyme digests? How might this be sorted out? Like RNA-Seq, the bottom panel shows the comparative analysis of replicate samples from the wild type (WT) and transgenic (TG) mice.

Data from a small RNA analysis experiment are analyzed in the third panel. Unlike RNA-Seq and Tag Profiling, this secondary analysis has more comparisons of the reads to different sets of reference sequences. The purpose is to identify and filter out common artifacts observed in small RNA preparations. The pipeline we used, and data produced, are shown in the middle of the panel. Histogram plots of read length distribution, determined from alignments in different reference sources, are created because an important feature of small RNAs is that they are small. Distributions clustered around 22 nt indicate a good library. Finally, data are linked to additional reports and databases, like miRBase (Sanger Center), to explore results further. In the example shown, the first hit was to a small RNA that has been observed in opossums; now we have human counter part. In total, four, samples were studied. Like RNA-Seq and Tag Profiling, we can observe the relative expression of each small RNA by analyzing the datasets together (hierarchical clustering, bottom).

Section 6 presents some of the challenges of scale issues that accompany NGS, and how we are addressing these issues with HDF5 technology. This will be a topic of many more posts in the future.

We close the poster by addressing the challenges listed above with the final points:
  • High performance data management systems are being developed through the BioHDF project and GeneSifter system architectures.
  • The examples show how each application and sequencing platform requires a different data analysis workflow (pipeline). GeneSifter provides a platform to develop and make bioinformatics pipelines and data readily available to communities of biologists.
  • The transcriptome is complex, different libraries of sequence data can filter known sequences (e.g. rRNA) and discover new elements (miRNAs) and isoforms of expressed genes.
  • Within a dataset, read maps, tables, and histogram plots are needed to summarize and understand the kinds of sequences present and how they relate to an experiment.
  • Links to Entrez Gene, the USCS genome browser, and miRBASE, show how additional information can be integrated into the application framework and used.
  • Next Gen transcriptomics assays are similar to microarray assays in many ways, hence software systems like Geospiza’s GeneSifter are useful for comparative analysis.
You can also get the file, AGBT_2009.pdf

Sunday, February 15, 2009

Three Themes from ABRF and AGBT Part I: The Laboratory Challenge

It's been an exciting week on the road at the AGBT and ABRF conferences. From the many presentations and discussions it is clear that the current and future next generation DNA sequencing (NGS) technologies are changing the way we think about genomics and molecular biology. It is also clear that successfully using these technologies impacts research and core laboratories in three significant areas:
  1. The Laboratory: Running successful experiments requires careful attention to detail.
  2. Bioinformatics: Every presentation called out bioinformatics as a major bottleneck. The data are hard to work with and different NGS experiments require different specialized bioinformatics workflows (pipelines).
  3. Information Technology (IT): The bioinformatics bottleneck is exacerbated by IT issues involving data storage, computation, and data transfer bandwidth.

We kicked off ABRF by participating in the Next Gen DNA Sequencing workshop on Saturday (Feb. 7). It was extremely well attended with presentations on experiences in setting up labs for Next Gen sequencing, preparing DNA libraries for sequencing, and dealing with the IT and bioinformatics.

I had the opportunity to provide the “overview” talk. In that presentation “From Reads to Datasets, Why Next Gen is not Sanger Sequencing,” I focused on the kinds of things you can do with NGS technology, its power, and the high level issues that groups are facing today when implementing these systems. I also introduced one of our research projects on developing scalable infrastructures using HDF5 for Next Gen bioinformatics and high-performing, dynamic, software interfaces. Three themes resufraced again and again throughout the day:  one must pay attention to laboratory details, bioinformatics is a bottleneck, and don't underestimate the impact of NGS systems on IT.

In this post, I'll discuss the laboratory details and visit the other themes in posts to come.

Laboratory Management

To better understand the impact of NGS on the lab, we can compare it to Sanger sequencing. In the table below, different categories ranging from the kinds of samples, to their preparation, to the data, are considered to show how NGS differs from Sanger sequencing. Sequencing samples for example are very different between Sanger and NGS. In Sanger sequencing, one typically works with clones or PCR amplicons. Each sample (clone or PCR product) produces a single sequence read. Overall, sequencing systems are robust, so the biggest challenges to labs has been tracking the samples as they move from tube to plate or between wells within plates.

In contrast, NGS experiments involve sequencing DNA libraries and each sample produces millions of reads. Presently, only a few samples are sequenced at a time so the sample tracking issues, when compared to Sanger, are greatly reduced. Indeed, one of the significant advantages and cost savings of NGS is to eliminate the need for cloning or PCR amplification in preparing templates to sequence.

Directly sequencing DNA libraries is a key ability and a major factor that makes NGS so powerful. It also directly contributes to the bioinformatics complexity (more on that in the next post). Each one of the millions of reads that are produced from the sample corresponds to an individual molecule, present in the DNA library. Thus, the overall quality of the data and the things you can learn are a direct function of the library.


Producing good libraries requires that you have a good handle on many factors. To begin, you will need to track RNA and DNA concentrations, at different steps of the process. You also need to know the “quality” of the molecules in the sample. For example, RNA assays will give the best results when RNA is carefully prepared and free of RNAses. In RNA-Seq, the best results are obtained when the RNA is fragmented prior to cDNA synthesis. To understand the quality of the starting RNA, fragmentation, and cDNA synthesis steps, tools like agarose gels or Bioanalyzer traces are used to evaluate fragment lengths and determine overall sample quality. Other assays and sequencing projects have similar processes. Throughout both conferences, it was stressed that regardless of whether you are sequencing genomes, small RNAs, performing an RNA-Seq, or other “tag and count” kinds of experiments, you need to pay attention to the details of the process. Tools like the NanoDrop, or QPCR procedure need to be routinely used to measure RNA or DNA concentration. Tools like gels and the Bioanalyzer are used to measure sample quality. And, in many cases both kinds of tools are used.

Through many conversations, it became clear that Bioanalyzer images, Nanodrop reports, and other lab data quickly accumulate during these kinds of experiments. While an NGS experiment is in progress, these data are pretty accessible and the links between data quality and the collected data are easy to see. It only takes a few weeks, however,  for these lab data to disperse.  They find their way into paper notebooks, or unorganized folders on multiple computers. When the results from one sample need to be compared to another,  a new problem appears. It becomes harder and harder to find the lab data that correspond to each sample.

To summarize, NGS technology makes it possible to interrogate large ensembles of individual RNA or DNA molecules. Different questions can be asked by preparing the ensembles (libraries) in different ways involving complex procedures. To ensure that the resulting data are useful, the libraries need to be of high and known quality. Quality is measured with multiple tools at different points of the process to produce multiple forms of laboratory data. Traditional methods such as laboratory notebooks, files on computers, and post-it notes however, make these data hard to find when the time comes to compare results between samples.

Fortunately, the GeneSifter Lab Edition solves these challenges. The Lab Edition of Geospiza’s software platform provides a comprehensive laboratory information management system (LIMS) for NGS and other kinds of genetic analysis assays, experiments, and projects. Using web-based interfaces, laboratories can define protocols (laboratory workflows) with any number of steps. Steps may be ordered and required to ensure that procedures are correctly followed. Within each step, the laboratory can define and collect different kinds of custom data (Nanodrop values, Bioanalyzer traces, gel images, ...). Laboratories using the GeneSifter Lab Edition can produce more reliable information because they can track the details of their library preparation and link key laboratory data to sequencing results.

Monday, February 2, 2009

Next Gen Laboratory Software Systems for Core Facilities

Do you have a core lab? Considering adding Next Generation DNA sequencing capacity to your lab? Then you will be interested in visiting our both and checking out our poster at the annual Association for Biomolecular Research Facilities (ABRF) meeting next week in Memphis TN. We'll be at booth 408, and presenting poster number V27-S1.

Poster Abstract

Throughout the past year, as next generation sequencing (NGS) technologies have emerged in the marketplace, their promise of what can be done with massive amounts of sequence data has been tempered with the reality that performing experiments and working with the data is extremely challenging. As core labs contemplate acquiring NGS technologies, they must consider how the new technologies will affect their current and future operations. The old model of collecting and delivering data is likely to change to one where the core lab becomes an active participant in advising and helping clients set up experiments and analyze the data. However, while many labs want to utilize NGS, few have the Information Technology (IT) infrastructures and procedures in place to successfully make use of these systems.

In the case of gene expression, NGS technologies are being evaluated as complementary or replacement technologies for microarrays. Assays like RNA-Seq and tag profiling, that focus on measuring relative gene expression, require that researchers and core labs must puzzle through a diverse collection of early version algorithms that are combined into complicated workflows with many steps producing complicated file formats. Command line tools such as MAQ, SOAP, MapReads, and BWA, have specialized requirements for formatted input and output and leave researchers with large data files that still require additional processing and formatting for tertiary analyses. Moreover, once reads are aligned, datasets need to be visualized and further refined for additional comparative analysis. We present solutions to these challenges by showing results from a complete workflow system that includes data collection, processing, and analysis for RNA-seq suited for the core laboratory.

In the poster we'll walk through the laboratory and data analysis issues one needs to think about to perform a two cell expression comparison with RNA-Seq. Below is a snippet from the poster. I'll post the full presentation when I return.

Wednesday, January 28, 2009

The Next Generation Dilemma: Large Scale Data Analysis

Next week is the AGBT genome conference in Marco Island, Florida. At the conference we will present a poster on work we have been doing with Next Gen Sequencing data analysis. In this post we present the abstract. We'll post the poster when we return from sunny Florida.

Abstract

The volumes of data that can be obtained from Next Generation DNA sequencing instruments make several new kinds of experiments possible and new questions amenable to study. The scale of subsequent analyses, however, presents a new kind of challenge. How do we get from a collection of several million short sequences of bases to genome-scale results? This process involves three stages of analysis that can be described as primary, secondary, and tertiary data analyses. At the first stage, primary data analysis, image data are converted to sequence data. In the middle stage, secondary data analysis, sequences are aligned to reference data to create application-specific data sets for each sample. In the final stage, tertiary data analysis, the data sets are compared to create experiment-specific results. Currently, the software for the primary analyses is provided by the instrument manufacturers and handled within the instrument itself, and when it comes to the tertiary analyses, many good tools already exist. However, between the primary and tertiary analyses lies a gap.

In RNA-Seq, the process of determining relative gene expression means that sequence data from multiple samples must go through the entire process of primary, secondary, and tertiary analysis. To do this work, researchers must puzzle through a diverse collection of early version algorithms that are combined into complicated workflows with steps producing complicated file formats. Command line tools such as MAQ, SOAP, MapReads, and BWA, have specialized requirements for formatted input and output and leave researchers with large data files that still require additional processing and formatting for tertiary analyses. Moreover, once reads are aligned, datasets need to be visualized and further refined for additional comparative analysis. We present a solution to these challenges that closes the gaps between primary, secondary, and tertiary analysis by showing results from a complete workflow system that includes data collection, processing and analysis for RNA-seq.

And, if you cannot be in sunny Florida, join us in Memphis where we will help kick off the ABRF conference with a workshop on Next Generation DNA Sequencing. I'm kicking the workshop off with a talk entitled "From Reads to Data Sets, Why Next Gen is Not Like Sanger Sequencing."

Wednesday, January 21, 2009

The Experts Agree

It depends what you are trying to do. That is the take home message in Genome Technology’s (GT) trouble-shooting guide on picking assembly and alignment algorithms for Next-Gen sequence data.

In the guide, the GT team asked nine Next-Gen sequencing and bioinformatics experts to answer six questions:
  1. How do you choose which alignment algorithm to use?
  2. How do you optimize your alignment algorithm for both high speed and low error rate?
  3. What approach do you use to handle mismatches or alignment gaps?
  4. How do you choose which assembly algorithm to use?
  5. Do you use mate-paired reads for de novo assembly? how?
  6. What impact does the quality of raw read data have on alignment or assembly? how do your algorithms enhance this?
Even a quick look at the questions shows us that many factors need to be considered in setting up a Next-Gen sequencing lab. Questions 1 and 4 point out that aligning sequences is different from assembling them. Other questions address issues related to the size of the data sets being compared, the quality of the data being analyzed, the kinds of information that can be obtained, and the computational approaches being used for different problems.

What the experts said

First, they all agree that different problems require different approaches and have different requirements. In the first question about which aligner to use, the most common response was “for what application and which instrument?” Fundamentally, SOLiD data are different from Illumina GA data which are different from 454 data. While the end results may all be sequences of A's, G's, C's, and T's; the data are derived in different ways because of the platform-specific twists in collecting the data (recall “Color Space, Flow Space, Sequence Space, or Outer Space). Not only are there platform-specific methods for interpreting raw data, multiple programs have been developed for each instrument with their own strengths and weaknesses in terms of speed, sensitivity, the kinds of data they use (color, base, or flow spaces, quality values, and paired end data), and the information that is finally produced. Hence, in addition to choosing a sequencing platform you also have to think about the sequencing application, or the kind of experiment, that will be performed. In gene expression studies, for example, an RNA-Seq experiment has different requirements in terms of aligning the data and interpreting the output than an experiment with Tag Profiling.

Overall the trouble-shooting guide discussed 17 total algorithms, eight for alignment, and nine for assembly (two of which were for Sanger methods). Even this selection wasn't a comprehensive list. When other sites [1, 2] and articles [3] are included and proprietary methods are factored in, over 20 algorithms are available. So what to do? Which is best?

That depends

Yes, the choice of algorithm ultimately depends on what you are trying to do. While we can agree that there is no best solution, we also know that is not a helpful response. What is needed is a way to test the suitability of different algorithms for different kinds of experiments and to represent data in standard ways so that the features of specific algorithms can be evaluated. Also, as this is a new field, standard requirements for how data should be aligned, defining a correct alignment, and what kinds of information are the most informative in describing alignments are still emerging. Some of the early programs are helping to define these requirements.

One program we've used, at Geopsiza, for identifying requirements is MAQ, a program for sequence alignment. As noted in previous blogs [MAQ attack], MAQ is a great general purpose tool. It provides comprehensive information about the data being aligned and details about alignments. MAQ works well for many applications including RNA-Seq, Tag Profiling, ChIP-Seq, and resequencing assays focused on SNP discovery. In performance tests, MAQ is slower than some of the newer programs, one of which is being developed by MAQ’s author, but MAQ is a good model for getting the right kinds of information, formatted in a decent way. Indeed MAQ was the most cited program in the GT guide.

Let’s return to the bigger issue. That is, how can we easily compare between algorithms? For that we need a system where one can easily define a standardized dataset and reference sequence, and have a platform where a new algorithm can be added and run from a common interface. Standard reports that present features of the alignments could then be used to compare programs and parameters.

The laboratory edition of GeneSifter supports these kinds of comparisons. The distributed system architecture allows one to quickly develop control scripts to run programs and format their output in figures and tables that make comparisons possible. With this kind of system in place, the challenges move from which program to run and how to run it, to how to get the right kinds of information and best display the data. To address these issues, Geospiza’s research and development team is working on projects focused on using technologies like HDF5 to create scalable standardized data models for storing information from alignment and assembly programs. Ultimately this work will make it easy to optimize Next-Gen sequencing applications and assays and compare between assorted programs.

References
1. http://en.wikipedia.org/wiki/Sequence_alignment_software,
2. http://www.massgenomics.org/2009/01/short-read-aligners-update-at-agbt.html
3. Shendure J., Ji H., 2008. Next-generation DNA sequencing. Nat Biotechnol 26, 1135-1145.

Thursday, November 20, 2008

Introducing GeneSifter

Today, Geospiza announced the acquisition of the award-winning GeneSifter microarray data analysis product. This news has significant implications for Geospiza’s current and new customers. With GeneSifter and FinchLab, Geospiza will deliver complete end to end systems for data intensive genetic analysis applications like Next Gen sequencing and microarrays.

As an example, let's consider transcriptomics or gene expression. One goal of such experiments is to compare the relative gene expression between cells to see how different genes are up or down regulated as the cells change over time or respond to some sort of treatment.

The general process, whether it involves microarrays or Next Gen sequencing, is to measure the number of RNA molecules for a given gene, either over a period of time or after different treatments. Laboratory processes create the molecules to assay, the molecules are measured, data are collected, and we process the data to produce tables of information. These tables are then compared with one another to identify genes that are differentially expressed. With the gene expression results in hand, one can delve deeper by utilizing other databases like Entrez Gene or pathway sites to learn about gene function and gain insights.

From a systems perspective, you need a LIMS to define sample information and keep track of workflow steps and the data generated at the bench. You will also need to track which samples are on a slide, or lane, or well when the data are collected. You will need to store and organize the data by sample. Then, you will need to analyze the data through multiple programs in a pipelined process (filter, align ...) to produce information, like gene lists, that can be compared for each sample. You may want to review this information to see that your experiments are on track and then, if they are, you will want to compare the gene lists from different experiments to tell a story.

FinchLab, combined with Geospiza’s hosted Software as a Service (SaaS) delivery, solves challenges related to IT, LIMS, and the core data analysis. GeneSifter completes the process by delivering a software solution that lets you compare your gene lists. GeneSifter provides information about the relative gene expression between samples and links gene information to key public resources to uncover additional details.

It's an exciting time for those in the genetic analysis and genomics fields. New high throughput data collection technologies are giving scientists the ability to interrogate systems and understand biology in a whole new way. As we come to the end of 2008 and think about 2009, Geospiza is excited to think about how we will integrate and extend our products to further develop end to end systems for a wide variety of genomics applications that target basic and clinical research to help us improve human health and well being.