Showing posts with label Illumina GA. Show all posts

Tuesday, June 7, 2011

DOE's 2011 Sequencing, Finishing, Analysis in the Future Meeting

Cactus at Bandelier
National Monument 
Last week, June 1-3, the Department of Energy held their annual Sequencing, Finishing, Analysis in the Future (SFAF) meeting in Santa Fe, New Mexico.  SFAF, also sponsored b the Joint Genome Institute, and Los Alamos National Laboratory and was attended by individuals from the major genome centers, commercial organizations, and smaller labs.

In addition to standard presentations and panel discussions from the genome centers and sequencing vendors (Life Technologies, Illumina, Roche 454, and Pacific Biosciences), and commercial tech talks, this year's meeting included a workshop on hybrid sequence assembly (mixing Illumina and 454 data, or Illumina and PacBio data). I also presented recent work on how 1000 Genomes and Complete Genomics data are changing our thinking about genetics (abstract below).

John McPherson from the Ontario Cancer Research Institute (OICR, a Geospiza client) gave the kickoff keynote. His talk focused on challenges in cancer sequencing. One of those being that DNA sequencing costs are now predominated by instrument maintenance, sample acquisition, preparation, and informatics, which are never included in the $1000 genome conversation. OICR is now producing 17 trillion bases per month and as they, and others, learn about cancer's complexity, the idea of finding single biochemical targets for magic bullet treatments is becoming less likely.

McPherson also discussed how OICR is getting involved clinical cancer sequencing. Because cancer is a genetic disease, measuring somatic mutations and copy number variations will be best for developing prognostic biomarkers. However, measuring such biomarkers in patients in order to calibrate treatments requires a fast turnaround time between tissue biopsy, sequence data collection, and analysis. Hence, McPherson sees IonTorrent and PacBio as the best platforms for future assays. McPherson closed his presentation stating that data integration is the grand challenge.  We're on it!

The remaining talks explored several aspects of DNA sequencing ranging from high throughput single cell sample preparation, to sequence alignment and de novo sequence assembly, to education and interesting biology. I especially liked Dan Distal's (New England Biolabs) presentation on the wood eating microbiome of shipworms. I learned that shipworms are actually little clams that use their shells as drills to harvest the wood. Understanding how the bacteria eat wood is important because we may be able to harness this ability for future energy production.

Finally, there was my presentation for which I've included the abstract.

What's a referenceable reference?

The goal behind investing time and money into finishing genomes to high levels of completeness and accuracy is that they will serve as a reference sequences for future research. Reference data are used as a standard to measure sequence variation, genomic structure, and study gene expression in microarray and DNA sequencing assays. The depth and quality of information that can be gained from such analyses is a direct function of the quality of the reference sequence and level of annotation. However, finishing genomes is expensive, arduous work. Moreover, in the light of what we are learning about genome and species complexity, it is worthwhile asking the question whether a single reference sequence is the best standard of comparison in genomics studies.

The human genome reference, for example, is well characterized, annotated, and represents a considerable investment. Despite these efforts, it is well understood that many gaps exist in even the most recent versions (hg19, build 37) [1], and many groups still use the previous version (hg18, build 36). Additionally, data emerging from the 1000 Genomes Project, Complete Genomics, and others have demonstrated that the variation between individual genomes is far greater than previously thought. This extreme variability has implications for genotyping microarrays, deep sequencing analysis, and other methods that rely on a single reference genome. Hence, we have analyzed several commonly used genomics tools that are based on the concept of a standard reference sequence, and have found that their underlying assumptions are incorrect. In light of these results, the time has come to question the utility and universality of single genome reference sequences and evaluate how to best understand and interpret genomics data in ways that take a high level of variability into account.

Todd Smith(1), Jeffrey Rosenfeld(2), Christopher Mason(3). (1) Geospiza Inc. Seattle, WA 98119, USA (2) Sackler Institute for Comparative Genomics, American Museum of Natural History, New York, NY 10024, USA (3) Weill Cornell Medical College, New York, NY 10021, USA

Kidd JM, Sampas N, Antonacci F, Graves T, Fulton R, Hayden HS, Alkan C, Malig M, Ventura M, Giannuzzi G, Kallicki J, Anderson P, Tsalenko A, Yamada NA, Tsang P, Kaul R, Wilson RK, Bruhn L, & Eichler EE (2010). Characterization of missing human genome sequences and copy-number polymorphic insertions. Nature methods, 7 (5), 365-71 PMID: 20440878

You can obtain abstracts for all of the presentations at the SFAF website.

Thursday, October 28, 2010

Bloginar: Making cancer transcriptome sequencing assays practical for the research and clinical scientist

A few weeks back we (Geospiza and Mayo Clinic) presented a research poster at BioMed Central’s Beyond the Genome conference. The objective was to present GeneSifter’s analysis capabilities and discuss the practical issues scientists face when using Next Generation DNA Sequencing (NGS) technologies to conduct clinically orientated research related to human heath and disease.

Abstract
NGS technologies are increasing in their appeal for studying cancer. Fully characterizing the more than 10,000 types and subtypes of cancer to develop biomarkers that can be used to clinically define tumors and target specific treatments requires large studies that examine specific tumors in 1000s of patients. This goal will fail without significantly reducing both data production and analysis costs so that the vast majority of cancer biologists and clinicians can conduct NGS assays and analyze their data in routine ways.

While sequencing costs are now inexpensive enough for small groups and individuals, beyond genome centers, to conduct the needed studies, the current data analysis methods need to move from large bioinformatics team approaches to automated methods that employ established tools in scalable and adaptable systems to provide standard reports and make results available for interactive exploration by biologists and clinicians. Mature software systems and cloud computing strategies can achieve this goal.

Poster Layo
ut
Excluding the title, the poster has five major sections. The first section includes the abstract (above) and study parameters. In the work, we examined the RNA from 24 head and neck cancer biopsies from 12 individuals' tumor and normal cells.

The remaining sections (2-5), provide a background of NGS challenges, applications, high-level data analysis workflows, the analysis pipeline used in the work, the comparative analyses that need to be conducted, and practical considerations for groups seeking to do similar work. Much of section 2 has been covered in previous blogs and research papers.

Section 3: Secondary Analysis Explores Single Samples
NGS challenges are best known for the amount of data produced by the instruments. While this challenge should not be undervalued, it is over discussed. A far greater challenge lies in the complexity of data analysis. Once the first step (primary analysis, or basecalling) is complete, the resulting millions of reads must be aligned to several collections of reference sequences. For human RNA samples, these include the human genome, splice junction databases, and others to measure biological processes and filter out reads arising from artifacts related to sample preparation. Aligned data are further processed to create tables that annotate individual reads and compute quantitative values related to how the sample’s reads align (or cover) regions of the genome or span exon boundaries. If the assay measures sequence variation, alignments must be further processed to create variant tables.

Secondary analysis produces a collection of data in forms that can be immediately examined to understand overall sample quality and characteristics. High-level summaries indicate how many reads align to things we are interested in and not interested in. In GeneSifter, these summaries are linked to additional reports that show additional detail. Gene List reports, for example, show how the sample reads align within a gene’s boundary. Pictures in these reports are linked to Genesifter's Gene Viewer reports that provide even greater detail about the data with respect to each read’s alignment orientation and observed variation.

An important point about secondary analysis, however, is that it focuses on single sample analyses. As more samples are added to the project, the data from each sample must be processed through an assay specific pipeline. This point is often missed in the NGS data analysis discussion. Moreover, systems supporting this work must not only automate 100s of secondary analysis steps, they must also provide tools to organize the input and output data in project-based ways for comparative analysis.

Section 4: Tertiary Analysis in GeneSifter Compares Data Between Samples
The science happens in NGS when data are compared between samples in statistically rigorous ways. RNA sequencing makes it possible to compare gene expression, exon expression, and sequence variation between samples to identify differentially expressed genes, their isoforms, and whether certain alleles are differentially expressed. Additional insights are gained when gene lists can be examined in pathways and by ontologies. GeneSifter performs these activities in a user-friendly web-environment.

The poster's examples show how gene expression can be globally analyzed for all 24 samples, how a splicing index can distinguish gene isoforms occurring in tumor, but not normal cells, and how sequence variation can be viewed across all samples. Principal component analysis shows that genes in tumor cells are differentially expressed relative to normal cells. Genes highly expressed in tumor cells include those related to cell cycle and other pathways associated with unregulated cell growth. While these observations are not novel, they do confirm our expectations about the samples and being able to make such an observation with just a few clicks prevents working on costly misleading observations. For genes showing differential exon expression, GeneSifter provides ways to identify those genes and navigate to the alignment details. Similarly reports that show differential variation between samples can be filtered by multiple criteria in reports that link to additional annotation details and read alignments.

Section 5: Practical Considerations
Complete NGS data analysis systems seamlessly integrate secondary and tertiary analysis. Presently, no other systems are as complete as GeneSifter. There are several reasons why this is the case. First, a significant amount of software must be produced and tested to create such a system. From complex data processing automation, to advanced data queries, to user interfaces that provide interactive visualizations and easy data access, to security, software systems must employ advanced technologies and take years to develop with experienced teams. Second, meeting NGS data processing requirements demands that computer systems be designed with distributable architectures that can support cloud environments in local and hosted configurations. Finally, scientific data systems must support both predefined and ad hoc query capabilities. The scale of NGS applications means that non-traditional approaches must be used to develop data persistence layers that can support a variety of data access methods and, for bioinformatics, this is a new problem.

Because Geospiza has been doing this kind of work for over a decade and could see the coming challenges, we’ve focused our research and development in the right ways to deliver a feature rich product that truly enables researchers to do high quality science with NGS.

Enjoy the poster.

Wednesday, September 29, 2010

A Genomics Genealogy

Deep sequencing technologies have radically changed how we study biology. Deciding what technology and software to use can be daunting. Choices become easier when the relationships between different DNA sequencing applications are understood.


A brief history 

DNA sequencing grew from our desire to understand how the instructions for the biochemistry of life are encoded in an organism’s DNA. If we know the precise ordering and organization of an organism’s DNA sequence, we can presumably unlock a code that reveals these instructions. Accomplishing this goal required the creation of a new field, molecular biology, and new technologies to sequence genes.

The first sequencing methods were arduous. They combined nuclease digestion with thin layer chromatography to measure di- and trinucleotides that could be puzzled together. Later, Maxim and Gilbert replaced enzymatic DNA degradation with a chemical fragmentation method that enabled the reading of ordered bases from 32P labeled fragments separated by electrophoresis.

The Sanger method, which used dideoxynucleotide triphosphates to create ensembles of DNA molecules terminated at each base, soon replaced Maxim Gilbert sequencing. The next innovation was to color code DNA with fluorescent dyes so that molecules could be interrogated with a laser and camera coupled to a computer. This innovation automated “high-throughput” DNA sequencing systems, initially with polyacrylamide gels and later with capillary electrophoresis, and made it possible to sequence the human and other genomes. It also created the first transcriptome analysis method, Expressed Tag Sequencing (EST).

Despite 20 years of advances, however, the high-throughput sequencing methods were not high-enough-throughput to realistically interrogate DNA and RNA molecules in creative ways. Big questions (genomes, ESTs, meta-genomes) required large factory-like approaches to automate sample preparation and collect sequences because a fundamental problem had yet to be solved. Specially, each sequence was obtained from an individual purified DNA clone or PCR product.

Real high-throughput is massively parallel throughput 

The next-generation DNA sequencing (NGS) technologies free researchers from the need to clone or purify every molecule. They all share the common innovation that DNA sequencing is performed in a massively parallel format. That is a library, or ensemble of millions of DNA molecules, are simultaneously sequenced. Data collection costs are dramatically decreased through miniaturization and by eliminating the need for warehouses of colony pickers, prep robots, sequencing instruments, and large teams of people.

The new problem is dealing with the data that are produced and increasing computation costs. As NGS opens new possibilities to measure DNA and RNA in novel ways, each application requires a specific laboratory procedure that must be coupled to a specific analysis methodology.

Sequencing genealogy is defined by the questions 

In an evolutionary model, the history of cloning, restriction site mapping, and Sanger sequencing form the trunk of the genomics application tree (top figure) from which branches develop as new applications emerge.

NGS has driven the evolution of three main sequencing branches: De Novo, Functional Genomics, and Variation Assays. The De Novo, or Exploratory, sequencing contains three subbranches that include new genomes (projects that seek to determine a complete genome sequence of an organism), meta-genomes (projects in which DNA fragments are sequenced from environmental samples), or meta-transcriptomes (projects where cDNA fragments are sequenced from environmental samples).


The Functional Genomics branch is growing fast. In these experiments, different collections of RNA or DNA molecules from an organism, tissue, or cells, are isolated and sequenced to measure gene expression and how it is regulated. Three subbranches describe the different kinds of function genomics: Expression, Regulation, and EpiGenomics, and each of these subbranches can be further divided into specific assay groups (DGE, RNA-Seq, small RNA, etc) that can be even further subdivided into specialized procedures (RNA-Seq with strandedness preserved) that are defined by laboratory protocols, kits, and instruments. When the experiments are refined and are made reproducible, they become assays.

Variation Assays form the third main branch of the tree. Genomic sequences are compared within and between populations to link genotype and phenotype. In special cases like cancer and immunology research, variation assays are used to observe changes within an organism’s somatic genomes over time. Today, variation, or resequencing, assays measure nucleotide and small insertions and deletions in whole genomes and exomes. If linked sequence strategies (mate-pairs, paired-ends) are used, larger structural changes including copy number variations can also be measured.

Why is this important?

As a software provider with both deep lab and analysis experience, we [Geospiza] are often asked questions about what instrument platform is the best or how our software stacks up against other available options. The answer, of course, depends on what you want to do. De Novo applications benefit from long reads offered by platforms like 454. Many of the assay-based applications demand ultra-deep sequencing with very high numbers of sequences (reads) as provided by the short-read platforms (Illumina, SOLiD). New single molecule sequencing platforms like PacBio's are targeting a wide rage of applications but have best been demonstrated, thus far, for long-read uses and novel methylation assays.

From an informatics perspective, the exploratory and assay-based branches have distinct software requirements. Exploratory applications require that reads be assembled into contigs that must be further ordered into scaffolds to get to the complete sequence. In meta-genomics or meta-transcriptomics applications, data are assembled to obtain gene sequences. These projects are further complicated by orthologous and paralogous sequences and highly expressed genes that over represent certain sequences. In these situations, specialized hardware or complex data reduction strategies are needed to make assembly practical. Once data are assembled, they are functionally annotated in a second computational phase using tools like BLAST.

Assay-based data analysis also has two distinct phases, but they are significantly different from De Novo sequencing. The first phase involves aligning (or mapping) reads to reference data sources and then reducing the aligned data into quantitative values. At least one reference is required and the better it is annotated the more informative the initial results will be. Alignment differs from assembly in that reads are separately compared to a reference rather than amongst themselves. Alignment processing capacity can be easily scaled with multiple inexpensive computers whereas assembly processing cannot.

The second phase of Assay-based sequencing is to produce a discrete output as defined by a diagnostic application, or compare the quantitative values computed from the alignments from several samples, obtained from different individuals and (or) treatments relative to controls. This phase requires statistical tools to normalize data, filter false positives and negatives, and measure differences. Assay-based applications become more informative when large numbers of samples and replicates are included in a study.

Connecting the dots 

While the sequencing applications can be grouped and summarized in different ways, they are also interrelated. For example, De Novo projects are open-ended and exploratory, but their end product, a well-annotated reference sequence, is the foundation for Functional Genomics and Variation applications. Variation analysis is only useful if we can assign function to specific genotypes. Functional assignments come, in part, from previous experiments and genomic annotations, but are increasingly being produced by sequencing assays, so the new challenge is integrating that data obtained from different assays into coherent datasets that can link many attributes to a set of genotypes.

NGS clearly opens new possibilities for studying and characterizing biological systems. Different applications require different sequencing platforms, laboratory procedures, and software systems that can organize analysis tools and automate data processing. On this last point, as one evaluates their projects and their options for being successful, they need to identify informatics groups that have deep experience, available solutions, and strong capabilities to meet the next challenges. Geospiza is one such group.

Further Reading

DNA Sequencing History

Gilbert W, Maxam A (1973) The nucleotide sequence of the lac operator. Proc Natl Acad Sci U S A 70:3581

Maxam AM, Gilbert W (1977) A new method for sequencing DNA. Proc Natl Acad Sci U S A 74:560

Sanger F, Nicklen S, Coulson AR (1977) DNA sequencing with chain-terminating inhibitors. Proc Natl Acad Sci U S A 74:5463-7

Smith LM, Sanders JZ, Kaiser RJ, Hughes P, Dodd C, Connell CR, Heiner C, Kent SB, Hood LE (1986) Fluorescence detection in automated DNA sequence analysis. Nature 321:674-9

Adams MD, Soares MB, Kerlavage AR, Fields C, Venter JC (1993) Rapid cdna sequencing (expressed sequence tags) from a directionally cloned human infant brain cdna library. Nat Genet 4:373-80

International Human Genome Sequencing Consortium, 2001. “Initial sequencing and analysis of the human genome.” Nature 409, 860-921.
Venter J.C., Adams M.D., Myers E.W., et. al. 2001. “The sequence of the human genome.” Science 291, 1304-1351.

FinchTalks

Friday, June 11, 2010

Levels of Quality

Next Generation Sequencing (NGS) data can produce more questions than answers. A recent LinkedIn discussion thread began with a simple question. “I would like to know how to obtain statistical analysis of data in a fastq file? number of High quality reads, "bad" reads....” This simple question opened a conversation about quality values, read mapping, and assembly. Obviously there is more to NGS data quality than simply separating bad reads from good ones.

Different levels of quality
Before we can understand data quality we need to understand what sequencing experiments measure and how the data are collected. In addition to sequencing genomes, many NGS experiments focus on measuring gene function and regulation by sequencing the fragments of DNA and RNA isolated and prepared in different ways. In these assays, complex laboratory procedures are followed to create specialized DNA libraries that are then sequenced in a massively parallel format.

Once the data are collected, they need to be analyzed in both common and specialized ways as defined by the particular application. The first step (primary analysis) converts image data, produced by different platforms into sequence data (reads). This step, specific to each sequencing platform, also produces a series of quality values (QVs), one value per base in a read, that define a probability that the base is correct. Next (secondary analysis), the reads and bases are aligned to known reference sequences, or, in the case of de novo sequencing, the data are assembled into contiguous units from which a consensus sequence is determined. The final steps (tertiary analysis) involve comparing alignments between samples or searching databases to get scientific meaning from the data. 

In each step of the analysis process, the data and information produced can be further analyzed to get multiple levels of quality information that reflect how well instruments performed, if processes worked, or whether samples were pure. We can group quality analyses into three general levels: QV analysis, sequence characteristics, and alignment information.

Quality Value Analysis
Many of the data quality control (QC) methods are derived from Sanger sequencing where QVs could be used to identify low quality regions that could indicate mixtures of molecules or define areas that should be removed before analysis. QV correlations with base composition could also be used to sort out systematic biases, like high GC content, that affect data quality. Unlike Sanger sequencing, where data in a trace represent an average of signals produced by ensemble of molecules, NGS provides single data points collected from individual molecules arrayed on a surface. NGS QV analysis uses counting statistics to summarize the individual values collected from the several million reads produced by each experiment.

Examples of useful counting statistics include measuring average QVs by base position, box and whisker (BW) plots, histogram plots of QV thresholds, and overall QV distributions. Average QVs by base, BW plots, and QV thresholds are used to see how QVs trend across the reads. In most cases, these plots show the general trend that data quality decreases toward the 3’ ends of reads. Average QVs by base show each base’s QV with error bars indicating the values that are within one standard deviation of the mean. BW plots provide additional detail to show the minimum and maximum QV, the median QV and the lower and upper quartile QV values for each base. Histogram plots of QV thresholds count the number of bases below threshold QVs (10, 20, 30). This methods provides information about potential errors in the data and its utility in applications like RNA-seq or genotyping. Finally distributions of all QVs or the average QV per read can give additional indications of dataset quality.

QV analysis primarily measures sequencing and instrument run quality. For example, sharp drop offs in average QVs can identify systematic issues related to the sequencing reactions. Comparing data between lanes or chambers within a flowcell can flag problems with reagent flow or imaging issues within the instrument. In more detailed analyses, the coordinate positions for each read can be used to reconstruct quality patterns for very small regions (tiles) within a slide to reveal subtle features about the instrument run.

Sequence Characteristics
In addition to QV analysis we can look the sequences of the reads to get additional information. If we simply count the numbers of A’s, C’s, G’s, or T’s (or color values), at each base position, we can observe sequence biases in our dataset. Adaptor sequences, for example, will show sharp spikes in the data, whereas random sequences will give us an even distribution, or bias that reflects the GC content of the organism being analyzed. Single stranded data will often show a separation of the individual base lines; double stranded coverage should have equal numbers of AT and GC bases.

We can also compare each read to the other reads in the dataset to estimate the overall randomness, or complexity, of our data. Depending on the application, a low complexity dataset, one with a high number of exactly matching reads, can indicate PCR biases or a large number of repeats in the case of de novo sequencing. In other cases, like tag profiling assays, which measure gene expression by sequencing a small fragment from each gene, low complexity data are normal because highly expressed genes will contribute a large number of identical sequences.

Alignment Information
Additional sample and data quality can be measured after secondary analysis. Once the reads are aligned (mapped) to reference data sources we can ask questions that reflect both run and sample quality. The overall number of reads that can be aligned to all sources can also be used to estimate parameters related to library preparation and deposition of the molecules on the beads or slides used for sequencing. Current NGS processes are based on probabilistic methods for separating DNA molecules. Illumina, SOLiD, and 454 all differ with respect to their separation methods, but share the common feature that the highest data yield occurs when concentration of DNA is just right. The number of mappable reads can measure this property.

DNA concentration measures one aspect of sample quality. Examining which reference sources reads align to gives further information. For example, the goal of transcriptome analysis is to sequence non-ribosomal RNA (rRNA). Unfortunately rRNA is the most abundant RNA in a cell. Hence transcriptome assays involve steps to remove rRNA and a large number of rRNA reads in the data indicates problems with the preparation. In exome sequencing or other methods where certain DNA fragments are enriched, the ratio of exon (enriched) and non-exon (non-enriched) alignments can reveal how well the purification worked.

Read mapping, however, is not a complete way to measure data quality. High quality reads that do not match any reference data in the analysis pipeline could be from unknown laboratory contaminants, sequences like novel viruses or phage, or incomplete reference data. Unfortunately, the former case is the more common, so it is a good idea to include reference data for all ongoing projects in the analysis pipeline. Alignments to adaptor sequences can reveal issues related to preparation processes and PCR, and the positions of alignments can be used to measure DNA or RNA fragment lengths.

So Many Questions
The above examples provide a short tour of how NGS data can be analyzed to measure the quality of samples, experiments, protocol and instrument performances. NGS assays are complex and involve multistep lab procedures and data analysis pipelines that are specific to different kinds of applications. Sequence bases and their quality values provide information about instrument runs and some insights into samples and preparation quality. Additional, information are obtained after the data are aligned to multiple reference data sources. Data quality analysis is most useful when values are computed shortly after data are collected, and systems, like GeneSifter Lab and Analysis Editions, that automate these analyses are important investments if labs plan to be successful with their NGS experiments.

Thursday, April 22, 2010

Bloginar: RNA Deep Sequencing: Beyond Proof of Concept

RNA-Seq is a powerful method for measuring gene expression because you can use the deep sequence data to measure transcript abundance and also determine how transcripts are spliced and whether alleles of genes are expressed differentially.  

At this year’s ABRF (Association for Biomedical Research Facilities) conference, we presented a poster, using data from published study, to demonstrate how GeneSifter Analysis Edition (GSAE) can be used in next generation DNA sequencing (NGS) assays that seek to compare gene expression and alternative splicing between different tissues, conditions, or species.

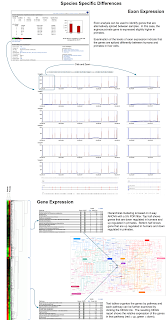
The following map guides the presentation. The poster has a title and four main sections, which cover background information, introduction to the published work and data, ways to observe alternative splicing and global gene expression differences between samples, and ways to observe sex specific gene expression differences. The last section also identifies a mistake made by the authors.  


Section 1. The first section begins with the abstract and lists five specific challenges created by NGS: 1) high end computing infrastructures are needed to work with NGS data, 2) NGS data analysis involves complex multistep processes, 3) NGS data need to be compared to many reference databases, 4) the resulting datasets of alignments must be visualized in different ways, and 5) scientific knowledge is gained when several aligned datasets are compared. 

Next, we are reminded that NGS data are analyzed in three phases: primary analysis, secondary analysis and tertiary analysis. Primary analysis is the step that converts images to reads consisting of basecalls (or colors, or flowgrams), and quality values. In secondary analysis, reads are aligned to reference data (mapped) or amongst themselves (assembled). Secondary analysis produces tables of alignments that must be compared to one and other, in tertiary analysis, to gain scientific insights. 

Finally, GSAE is introduced as a platform for scalable data analysis. GSAE’s key features and advantages are listed along with several screen shots to show the many ways in which analyzed data can be presented to gain scientific insights.  

Section 2 introduces the RNA-Seq data used for the presentation. These data, from a study that set out to measure sex and lineage specific alternative splicing in primates [1], were obtained from the Gene Expression Omnibus (GEO) database at NCBI, transferred into GSAE, and processed through GSAE’s RNA-Seq analysis pipelines.  We chose this study because it models a proper expression analysis using replicated samples to compare different cases.

All steps of the process, from loading the data to processing the files and viewing results were executed through GSAE’s web-based interfaces. The four general steps of the process are outlined in the box labeled “Steps.” 

The section ends with screen shots from GSAE showing how the primary data can be viewed and a list of the reports showing different alignment results for each sample in the list. The reports are accessed from a “Navigation Panel” that contains links to Alignment Summaries, a Filter Report, and a Searchable Sortable Gene List (shown), and several other reports (not shown). 

The Alignment Summary provides information about the numbers of reads mapping to different reference data sources that are used in the analysis to understand sample quality and study biology. For example, in RNA-Seq, it is important to measure and filter reads matching ribosomal RNA (rRNA) because the amount of rRNA present indicates how well clean up procedures work. Similarly, the number of reads matching adaptors indicates how well the library was prepared. Biological, or discovery based, filters include reads matching novel exon junctions and intergenic regions of the genome.

Other reports like the Filter Report and Gene List provide additional detail. The Filter Report clusters alignments and plots base coverage (read density) across genomic regions. Some regions, like mitochondrial DNA, and rRNA genes, or transcripts, are annotated. Others are not. These regions can be used to identify areas of novel transcription activity.

The Gene List provides the most detail and gives a comprehensive overview of the number of reads matching a gene, numbers of normalized reads, and the counts of novel splices, single nucleotide variants (SNVs), and small insertions and deletions (indels). Read densities are plotted as small graphs to reveal each gene’s exon/intron structure. Additional columns provide the gene’s name, chromosome, and contain links to further details in Entrez. The graphs are linked to the Integrated Gene Viewer to explore the data further. Finally, the Gene LIst is an interactive report that can searched, sorted, and filtered in different ways, so you can easily view the details of your gene or chromosome of interest.

Section 3 shows how GSAE can be used to measure global gene expression and examine the details for a gene that is differentially expressed between samples. In the case of RNA-Seq, or exon arrays, relative exon levels can be measured to observe genes that are spliced differently between samples. The presented example focuses on the arginosuccinate synthetase 1 (ASS1) gene and compares the expression levels of its transcripts and exons between the six replicated human and primate male samples.

The Gene Summary report shows that ASS1 is down regulated by 1.38 times in the human samples. More interestingly, the exon usage plot shows that this gene is differentially spliced between the species. Read alignment data, supporting this observation, are viewed by clicking the “View Exon Data” link that is below the Exon Usage heat map. This link brings up the Integrated Gene Viewer (IGV) for all six samples. In addition to showing read densities across the gene, IGV also shows the numbers of reads that span exon junctions as loops with heights proportional to the number of reads mapping to a given junction. In these plots we see that the human samples are missing the second exon whereas the primate samples show two forms of the transcript. IGV also includes the Entrez annotations and known isoforms for the gene and the positions of known SNPs from dbSNP.  And, IGV is interactive; controls at the top of the report and regions within the gene map windows are used to navigate to new locations and zoom in or out of the data presented.  When multiple genes are compared, the data are updated for all genes simultaneously. 

Section 3 closes with heat map representing global gene expression for the samples being compared. Expression data are clustered using a 2-way ANOVA with 5% false discovery filter (FDR). The top half of the hierarchical cluster groups genes that are down regulated in humans and up regulated in primates and the bottom half groups genes that are expressed in the opposite fashion. The differentially expressed genes can also be viewed in Pathway Reports which show how many genes are up or down regulated in a particular Gene Ontology (GO) pathway.  Links in these reports navigate to lists of the individual genes or their KEGG pathways.  When a KEGG pathway is displayed, the genes that are differentially expressed are highlighted.
Section 4 focuses on the sex specific differences in gene expression between the human and primate samples. In this example, 12 samples are being compared: three replicates for the male and female samples of two species. When these data were reanalyzed in GSAE, we were able to note that an obvious mistake. By examining Y chromosome gene expression, it was clear that one of the human male samples (M2-2) was lacking expression of these genes. Similarly, when the X (inactive)-specific transcript (XIST) was examined, M2-2 showed high expression like the other female samples. The simplest explanations for these observations are that either M2-2 is a female, or a dataset was copied and mislabeled in GEO. However, given that the 12 datasets show subtle differences, it is likely that they are all different and the first explanation is more likely. 

The poster closes with a sidebar showing how GSAE can be used to measure global sequence variation and the take home points for the presentation. The most significant being that if the authors of the paper had used a system like GSAE, they could have quickly observed the problems in their data that we saw and prevented a mistake. 

To see how you can use GSAE for your data sign up for a trial

1. Sex-specific and lineage-specific alternative splicing in primates. Blekhman R, Marioni JC, Zumbo P, Stephens M, Gilad Y,. Genome Res. published online December 15, 2009

Wednesday, January 13, 2010

2010 sequencing starts in style

Next Generation Sequencing (NGS) is a hot topic. As we kick off 2010, many themes continue. Data throughput is increasing, sequencing costs are decreasing, and NGS still requires extensive informatics support.

Throughput up, costs down

As sequencing throughput increases, the costs for collecting sequencing data decrease. Illumina is setting the pace for 2010 by announcing its latest sequencing instrument, the HiSeq2000. Illumina’s press release, news reports, and the blogosphere enthusiastically report on the instrument’s five fold increase in data throughput and ability to sequence an entire human genome in about one week for about $10,000.

What about the informatics?

This month’s reviews and editorials in Nature Reviews Genetics (NRG) and Nature Biotechnology (NBT), respectively, claim that the most significant NGS challenge continues to be dealing with the data. As pointed out in the NRG editorial, it is quite possible that the community will produce more sequence data this year than has been cumulatively produced in the past 10 years. The HiSeq, developments that will be announced by Applied Biosystems in February, and the coming single molecule sequencers support this. The editorial further makes the point that genome centers have the computing infrastructure to deal with the data, but the larger community of researchers, who could benefit from these technologies, do not. A similar observation was made at the end of the NBT review which pointed out that costs associated with downstream handling and processing of the data will possibly equal or exceed data collection costs.

The significance of the informatics challenge is that wide adoption of NGS technologies assumes that we have usable solutions for working with the data. These solutions go beyond simply getting a computer cluster with a sequencing instrument. To be useful, that cluster needs to reside in an adequately air conditioned room, be operated by people who know how to work with cluster hardware and software and can also optimize networks to manage the flow of data. Other individuals are needed who can write programs and scripts to process the data, work with multiple database technologies, and develop scalable user interfaces to visualize and navigate through the results and compare information between multiple samples and experiments.

The conversation about the informatics problem began with the introduction of NGS technologies. In 2008, Nature Methods (July) and NBT (October) published editorials speaking to the coming challenges. Later in 2009, Science published a new article about data intensive science. Previous FinchTalks have discussed the articles and their significance and the theme has remained the same; both the access to computing technologies and the skills needed to use the data are unavailable to the large numbers of researchers who need to use these technologies to remain competitive.

There is a solution

One solution to the informatics challenge created by NGS, and other data intensive technologies, is to make use of the immense Internet-based computing infrastructure that has been created by companies like Amazon, Google, Yahoo, and others. Also called Cloud Computing, Internet-based services remove many of the hardware and infrastructure barriers for utilizing high performance computing and storage technology. This message was delivered by the 2010 NBT kick off editorial and accompanying news feature, along with the next important message that software solutions also need to be adapted to cloud environments. Here the editorial, like many other descriptions of NGS informatics needs, falls short in that they only focus on alignment programs. Simply adapting alignment algorithms using technologies like Hadoop to employ Cloud-based high performance computing clusters is not a sufficient solution.

Aligning billions of reads to reference data quickly and accurately is clearly important. However it is just the first step of a complex analysis process. The subsequent steps of analyzing the billions of alignments to filter artifacts, identify true and new variation between sequences, discover alternative splice forms in transcripts, and compare data between samples are even more challenging.

Fortunately Geospiza understands the problem well. As our tag line, From Samples to ResultsTM, suggests, our lab and analysis systems focus on solving a complete set of problems that need to be addressed in order to do good science with NGS and other genetic analysis technologies.

Perhaps this is way we were the only software provider discussed in the NBT news feature, “Up in a cloud.”

Wednesday, September 23, 2009

GeneSifter in Current Protocols

This month we are pleased to report Geospiza's publication of the first standard protocols for analyzing Next Generation Sequencing (NGS) data. The pulication, appearing in the September issue of Current Protocols, addresses how to analyze data from both microarray, and NGS experiments. The abstract and links to the paper and our press release are provided below.

Abstract

Transcription profiling with microarrays has become a standard procedure for comparing the levels of gene expression between pairs of samples, or multiple samples following different experimental treatments. New technologies, collectively known as next-generation DNA sequencing methods, are also starting to be used for transcriptome analysis. These technologies, with their low background, large capacity for data collection, and dynamic range, provide a powerful and complementary tool to the assays that formerly relied on microarrays. In this chapter, we describe two protocols for working with microarray data from pairs of samples and samples treated with multiple conditions, and discuss alternative protocols for carrying out similar analyses with next-generation DNA sequencing data from two different instrument platforms (Illumina GA and Applied Biosystems SOLiD).

In the chapter we cover the following protocols:
  • Basic Protocol 1: Comparing Gene Expression from Paired Sample Data Obtained from Microarray Experiments
  • Alternate Protocol 1: Compare Gene Expression from Paired Samples Obtained from Transcriptome Profiling Assays by Next-Generation DNA Sequencing
  • Basic Protocol 2: Comparing Gene Expression from Microarray Experiments with Multiple Conditions
  • Alternate Protocol 2: Compare Gene Expression from Next-Generation DNA Sequencing Data Obtained from Multiple Conditions

Links

To view the abstract, contents, figures, and literature cited online visit: Curr. Protoc. Bioinform. 27:7.14.1-7.14.34

To view the press release visit: Geospiza Team Publishes First Standard Protocol for Next Gen Data Analysis