While there is debate and discussion about how genomics will be used in public health at a personalized medicine level, it is clear that rapid high-troughput DNA sequencing has immediate utility in epidemiological applications that seek to understand the origins of disease outbreaks.
In the most recent application, published this month, researchers at Pacific Biosciences (PacBio) used their PacBio RS sequencing system to identify the origins of the cholera outbreak in Haiti. According to the article, cholera as been present in Latin America since 1991, but is had not been epidemic in Haiti for at least 100 years. When the recent outbreak began in October this year, it was important to determine the origins of the disease, especially since it was concluded that Haiti had a low cholera risk following the earthquake. Understanding the origins of a disease can help define virulence and resistance mechanisms to guide therapeutic approaches.
Sequencing organisms to discover their origins in outbreaks is not new. What is new is the speed at which this can be done. For example, it took two months for the SARS virus to be sequenced after the epidemic started. In the recent work, the sequencing was completed in four days. And, it was not just one isolate that was sequenced, but two, with 40 times larger genomes.
When the Haiti sequences were compared to the sequences of 23 other V. cholera strains, the data indicated that the Haiti strain matched strains from South Asia more closely than the endemic strains from Latin America. This finding tells us that the stain was likely introduced, perhaps by aid workers. Additional sequence analysis of the colera toxin genes also confirmed that the strain causing the epidemic produces more severe disease. From a public health perspective this is important because the less virulent, easier to treat, endemic stains can be displaced by more aggressive strains. The good news is that the new strain is sensitive to tetracycline, a first line antibiotic.
The above work clearly demonstrates how powerful DNA sequencing is in strain identification. The authors favored single molecule sequencing on PacBio because its cycle time is shorter than second generation technologies like Illumina, SOLiD, and 454 and its long read lengths better handle repeats.While these points may be argued by the respective instrument vendors, it is clear is that we are entering an era where we can go very quickly from isolating infectious agents to classifying them at very high resolution in unprecedented ways. DNA sequencing will have a significant role in diagnosing infectious agents.
Further reading:
Scientists Trace Origin of Recent Cholera Epidemic in Haiti, HHMI News
The Origin of the Haitian Cholera Outbreak Strain, NEJM 2010
Wednesday, December 15, 2010
Monday, November 22, 2010
GeneSifter Lab Edition 3.16
Recently, we released GeneSifter Laboratory Edition (GSLE) 3.16. Over 40 new features were added to improve laboratory workflow support, enhance multiplexing, make orders and their data easier to manage, and extend the system's application programming interfaces (APIs).
Laboratory Workflow Support
Several new features will make working in the lab easier and improve data tracking and how GSLE is used. Workflows now include the ability to validate data using data ranges, and use laboratory defined lists to track the details about how samples are processed. For Next Gen Sequencing (NGS), sample multiplexing has been extended to make it possible to define multiplexes and associate Barcodes, MIDs, or Indexes (or whatever else you like to call the little adapter tags) at any step of your process. Also, for those who use specific naming conventions to track process steps, sample naming conventions can be defined for process steps. Finally, to use the above features and view data, the workflow editor has been streamlined to simplify data entry, workflows can be versioned to track your lab's process improvements, and a new report builder makes workflow data easy to access and view.
 To better track samples organized in tubes, plates, slides, flowcells, freezers, buildings, and the universe, we have introduce a new tool called containers. Containers can be defined by the laboratory and are used to link samples to specific actions like sample storage or a data collection run. For example, Illumina flowcells can be created and have samples added. The flowcell can be run immediately or stored following cluster generation. When samples are added to a flowcell, a new visual interface simplifies adding mixtures of multiplexed samples, single samples in individual lanes, or single samples spread over several lanes. Other kinds of containers track sample storage and can be updated with bed scanners to track the arrangement of samples as they move through the lab. And, containers can contain workflows to manage more complex procedures.
Order and Sample Management

 Details matter, and GSLE 3.16 improves how you view them. Lab samples (templates) views now show all laboratory data associated with a sample on a single page. These data are organized in sections that can be collapsed so you can see the big picture, or focus on specific details. We also updated views of orders to make it easier to view their progress and made the orders easier to access when viewing data for release.
API Support
Some groups use GSLE as a stand alone system, others use GSLE in conjunction with external systems in commercial and very high-throughput production environments. To support the later case, GSLE has a set of rich data-driven APIs that enable system to system communication. In 3.16, the APIs have been extended to edit certain kinds of stored data, add large batches of laboratory samples, upload container maps to track samples, and manipulate charge codes with accounting systems.
Contact sales@geospiza.com to learn more.
Laboratory Workflow Support
Several new features will make working in the lab easier and improve data tracking and how GSLE is used. Workflows now include the ability to validate data using data ranges, and use laboratory defined lists to track the details about how samples are processed. For Next Gen Sequencing (NGS), sample multiplexing has been extended to make it possible to define multiplexes and associate Barcodes, MIDs, or Indexes (or whatever else you like to call the little adapter tags) at any step of your process. Also, for those who use specific naming conventions to track process steps, sample naming conventions can be defined for process steps. Finally, to use the above features and view data, the workflow editor has been streamlined to simplify data entry, workflows can be versioned to track your lab's process improvements, and a new report builder makes workflow data easy to access and view.
 To better track samples organized in tubes, plates, slides, flowcells, freezers, buildings, and the universe, we have introduce a new tool called containers. Containers can be defined by the laboratory and are used to link samples to specific actions like sample storage or a data collection run. For example, Illumina flowcells can be created and have samples added. The flowcell can be run immediately or stored following cluster generation. When samples are added to a flowcell, a new visual interface simplifies adding mixtures of multiplexed samples, single samples in individual lanes, or single samples spread over several lanes. Other kinds of containers track sample storage and can be updated with bed scanners to track the arrangement of samples as they move through the lab. And, containers can contain workflows to manage more complex procedures.
 Order and Sample Management

 Details matter, and GSLE 3.16 improves how you view them. Lab samples (templates) views now show all laboratory data associated with a sample on a single page. These data are organized in sections that can be collapsed so you can see the big picture, or focus on specific details. We also updated views of orders to make it easier to view their progress and made the orders easier to access when viewing data for release.
API Support
Some groups use GSLE as a stand alone system, others use GSLE in conjunction with external systems in commercial and very high-throughput production environments. To support the later case, GSLE has a set of rich data-driven APIs that enable system to system communication. In 3.16, the APIs have been extended to edit certain kinds of stored data, add large batches of laboratory samples, upload container maps to track samples, and manipulate charge codes with accounting systems.
Contact sales@geospiza.com to learn more.
Wednesday, November 3, 2010
Samples to Knowledge
Today Geospiza and Ingenuity announced a collaboration to integrate our respective GeneSifter Analysis Edition (GSAE) and Ingenuity Pathway Analysis (IPA) software systems.
Why is this important?
Geospiza has always been committed to providing our customers the most complete software systems for genetic analysis. Our LIMS [GeneSifter Laboratory Edition] and GSAE have worked together to form a comprehensive samples to results platform. From core labs, to individual research groups, to large scale sequencing centers, GSLE is used for collecting sample information, tracking sample processing, and organizing the resulting DNA sequences, microarray files, and other data. Advanced quality reports keep projects on track and within budget.
For many years, GSAE has provided a robust and scalable way to scientifically analyze the data collected for many samples. Complex datasets are reduced and normalized to produce quantitative values that can be compared between samples and within groups of samples. Additionally, GSAE has integrated open-source tools like Gene Ontologies and KEGG pathways to explore the biology associated with lists of differentially expressed genes. In the case of Next Generation Sequencing, GSAE has had the most comprehensive and integrated support for the entire data analysis workflow from basic quality assessment to sequence alignment and comparative analysis.
With Ingenuity we will be able to take data-driven biology exploration to a whole new level. The IPA system is a leading platform for discovering pathways and finding the relevant literature associated with genes and lists of genes that show differential expression in microarray analysis. Ingenuity's approach focuses on combining software curation with expert review to create a state-of-the-art system that gets scientists to actionable information more quickly than conventional methods.
Through this collaboration two leading companies will be working together to extend their support for NGS applications. GeneSifter's pathway analysis capabilities will increase and IPA's support will extend to NGS. Our customers will benefit by having access to the most advanced tools for turning vast amounts of data into biologically meaningful results to derive new knowledge.
Samples to ResultsTM becomes Samples to KnowledgeTM
Thursday, October 28, 2010
Bloginar: Making cancer transcriptome sequencing assays practical for the research and clinical scientist
A few weeks back we (Geospiza and Mayo Clinic) presented a research poster at BioMed Central’s Beyond the Genome conference. The objective was to present GeneSifter’s analysis capabilities and discuss the practical issues scientists face when using Next Generation DNA Sequencing (NGS) technologies to conduct clinically orientated research related to human heath and disease.
Abstract
NGS technologies are increasing in their appeal for studying cancer. Fully characterizing the more than 10,000 types and subtypes of cancer to develop biomarkers that can be used to clinically define tumors and target specific treatments requires large studies that examine specific tumors in 1000s of patients. This goal will fail without significantly reducing both data production and analysis costs so that the vast majority of cancer biologists and clinicians can conduct NGS assays and analyze their data in routine ways.
While sequencing costs are now inexpensive enough for small groups and individuals, beyond genome centers, to conduct the needed studies, the current data analysis methods need to move from large bioinformatics team approaches to automated methods that employ established tools in scalable and adaptable systems to provide standard reports and make results available for interactive exploration by biologists and clinicians. Mature software systems and cloud computing strategies can achieve this goal.
Poster Layout

The remaining sections (2-5), provide a background of NGS challenges, applications, high-level data analysis workflows, the analysis pipeline used in the work, the comparative analyses that need to be conducted, and practical considerations for groups seeking to do similar work. Much of section 2 has been covered in previous blogs and research papers.
Section 3: Secondary Analysis Explores Single Samples
NGS challenges are best known for the amount of data produced by the instruments. While this challenge should not be undervalued, it is over discussed. A far greater challenge lies in the complexity of data analysis. Once the first step (primary analysis, or basecalling) is complete, the resulting millions of reads must be aligned to several collections of reference sequences. For human RNA samples, these include the human genome, splice junction databases, and others to measure biological processes and filter out reads arising from artifacts related to sample preparation. Aligned data are further processed to create tables that annotate individual reads and compute quantitative values related to how the sample’s reads align (or cover) regions of the genome or span exon boundaries. If the assay measures sequence variation, alignments must be further processed to create variant tables.
Secondary analysis produces a collection of data in forms that can be immediately examined to understand overall sample quality and characteristics. High-level summaries indicate how many reads align to things we are interested in and not interested in. In GeneSifter, these summaries are linked to additional reports that show additional detail. Gene List reports, for example, show how the sample reads align within a gene’s boundary. Pictures in these reports are linked to Genesifter's Gene Viewer reports that provide even greater detail about the data with respect to each read’s alignment orientation and observed variation.
An important point about secondary analysis, however, is that it focuses on single sample analyses. As more samples are added to the project, the data from each sample must be processed through an assay specific pipeline. This point is often missed in the NGS data analysis discussion. Moreover, systems supporting this work must not only automate 100s of secondary analysis steps, they must also provide tools to organize the input and output data in project-based ways for comparative analysis.
Section 4: Tertiary Analysis in GeneSifter Compares Data Between Samples
The science happens in NGS when data are compared between samples in statistically rigorous ways. RNA sequencing makes it possible to compare gene expression, exon expression, and sequence variation between samples to identify differentially expressed genes, their isoforms, and whether certain alleles are differentially expressed. Additional insights are gained when gene lists can be examined in pathways and by ontologies. GeneSifter performs these activities in a user-friendly web-environment.
The poster's examples show how gene expression can be globally analyzed for all 24 samples, how a splicing index can distinguish gene isoforms occurring in tumor, but not normal cells, and how sequence variation can be viewed across all samples. Principal component analysis shows that genes in tumor cells are differentially expressed relative to normal cells. Genes highly expressed in tumor cells include those related to cell cycle and other pathways associated with unregulated cell growth. While these observations are not novel, they do confirm our expectations about the samples and being able to make such an observation with just a few clicks prevents working on costly misleading observations. For genes showing differential exon expression, GeneSifter provides ways to identify those genes and navigate to the alignment details. Similarly reports that show differential variation between samples can be filtered by multiple criteria in reports that link to additional annotation details and read alignments.
Section 5: Practical Considerations
Complete NGS data analysis systems seamlessly integrate secondary and tertiary analysis. Presently, no other systems are as complete as GeneSifter. There are several reasons why this is the case. First, a significant amount of software must be produced and tested to create such a system. From complex data processing automation, to advanced data queries, to user interfaces that provide interactive visualizations and easy data access, to security, software systems must employ advanced technologies and take years to develop with experienced teams. Second, meeting NGS data processing requirements demands that computer systems be designed with distributable architectures that can support cloud environments in local and hosted configurations. Finally, scientific data systems must support both predefined and ad hoc query capabilities. The scale of NGS applications means that non-traditional approaches must be used to develop data persistence layers that can support a variety of data access methods and, for bioinformatics, this is a new problem.
Because Geospiza has been doing this kind of work for over a decade and could see the coming challenges, we’ve focused our research and development in the right ways to deliver a feature rich product that truly enables researchers to do high quality science with NGS.
Enjoy the poster.

Wednesday, September 29, 2010
A Genomics Genealogy
Deep sequencing technologies have radically changed how we study biology. Deciding what technology and software to use can be daunting. Choices become easier when the relationships between different DNA sequencing applications are understood.

A brief history
DNA sequencing grew from our desire to understand how the instructions for the biochemistry of life are encoded in an organism’s DNA. If we know the precise ordering and organization of an organism’s DNA sequence, we can presumably unlock a code that reveals these instructions. Accomplishing this goal required the creation of a new field, molecular biology, and new technologies to sequence genes.
The first sequencing methods were arduous. They combined nuclease digestion with thin layer chromatography to measure di- and trinucleotides that could be puzzled together. Later, Maxim and Gilbert replaced enzymatic DNA degradation with a chemical fragmentation method that enabled the reading of ordered bases from 32P labeled fragments separated by electrophoresis.
The Sanger method, which used dideoxynucleotide triphosphates to create ensembles of DNA molecules terminated at each base, soon replaced Maxim Gilbert sequencing. The next innovation was to color code DNA with fluorescent dyes so that molecules could be interrogated with a laser and camera coupled to a computer. This innovation automated “high-throughput” DNA sequencing systems, initially with polyacrylamide gels and later with capillary electrophoresis, and made it possible to sequence the human and other genomes. It also created the first transcriptome analysis method, Expressed Tag Sequencing (EST).
Despite 20 years of advances, however, the high-throughput sequencing methods were not high-enough-throughput to realistically interrogate DNA and RNA molecules in creative ways. Big questions (genomes, ESTs, meta-genomes) required large factory-like approaches to automate sample preparation and collect sequences because a fundamental problem had yet to be solved. Specially, each sequence was obtained from an individual purified DNA clone or PCR product.
Real high-throughput is massively parallel throughput
The next-generation DNA sequencing (NGS) technologies free researchers from the need to clone or purify every molecule. They all share the common innovation that DNA sequencing is performed in a massively parallel format. That is a library, or ensemble of millions of DNA molecules, are simultaneously sequenced. Data collection costs are dramatically decreased through miniaturization and by eliminating the need for warehouses of colony pickers, prep robots, sequencing instruments, and large teams of people.
The new problem is dealing with the data that are produced and increasing computation costs. As NGS opens new possibilities to measure DNA and RNA in novel ways, each application requires a specific laboratory procedure that must be coupled to a specific analysis methodology.
Sequencing genealogy is defined by the questions
In an evolutionary model, the history of cloning, restriction site mapping, and Sanger sequencing form the trunk of the genomics application tree (top figure) from which branches develop as new applications emerge.
NGS has driven the evolution of three main sequencing branches: De Novo, Functional Genomics, and Variation Assays. The De Novo, or Exploratory, sequencing contains three subbranches that include new genomes (projects that seek to determine a complete genome sequence of an organism), meta-genomes (projects in which DNA fragments are sequenced from environmental samples), or meta-transcriptomes (projects where cDNA fragments are sequenced from environmental samples).

The Functional Genomics branch is growing fast. In these experiments, different collections of RNA or DNA molecules from an organism, tissue, or cells, are isolated and sequenced to measure gene expression and how it is regulated. Three subbranches describe the different kinds of function genomics: Expression, Regulation, and EpiGenomics, and each of these subbranches can be further divided into specific assay groups (DGE, RNA-Seq, small RNA, etc) that can be even further subdivided into specialized procedures (RNA-Seq with strandedness preserved) that are defined by laboratory protocols, kits, and instruments. When the experiments are refined and are made reproducible, they become assays.
Variation Assays form the third main branch of the tree. Genomic sequences are compared within and between populations to link genotype and phenotype. In special cases like cancer and immunology research, variation assays are used to observe changes within an organism’s somatic genomes over time. Today, variation, or resequencing, assays measure nucleotide and small insertions and deletions in whole genomes and exomes. If linked sequence strategies (mate-pairs, paired-ends) are used, larger structural changes including copy number variations can also be measured.
 Why is this important?
As a software provider with both deep lab and analysis experience, we [Geospiza] are often asked questions about what instrument platform is the best or how our software stacks up against other available options. The answer, of course, depends on what you want to do. De Novo applications benefit from long reads offered by platforms like 454. Many of the assay-based applications demand ultra-deep sequencing with very high numbers of sequences (reads) as provided by the short-read platforms (Illumina, SOLiD). New single molecule sequencing platforms like PacBio's are targeting a wide rage of applications but have best been demonstrated, thus far, for long-read uses and novel methylation assays.
From an informatics perspective, the exploratory and assay-based branches have distinct software requirements. Exploratory applications require that reads be assembled into contigs that must be further ordered into scaffolds to get to the complete sequence. In meta-genomics or meta-transcriptomics applications, data are assembled to obtain gene sequences. These projects are further complicated by orthologous and paralogous sequences and highly expressed genes that over represent certain sequences. In these situations, specialized hardware or complex data reduction strategies are needed to make assembly practical. Once data are assembled, they are functionally annotated in a second computational phase using tools like BLAST.
Assay-based data analysis also has two distinct phases, but they are significantly different from De Novo sequencing. The first phase involves aligning (or mapping) reads to reference data sources and then reducing the aligned data into quantitative values. At least one reference is required and the better it is annotated the more informative the initial results will be. Alignment differs from assembly in that reads are separately compared to a reference rather than amongst themselves. Alignment processing capacity can be easily scaled with multiple inexpensive computers whereas assembly processing cannot.
The second phase of Assay-based sequencing is to produce a discrete output as defined by a diagnostic application, or compare the quantitative values computed from the alignments from several samples, obtained from different individuals and (or) treatments relative to controls. This phase requires statistical tools to normalize data, filter false positives and negatives, and measure differences. Assay-based applications become more informative when large numbers of samples and replicates are included in a study.
Connecting the dots
While the sequencing applications can be grouped and summarized in different ways, they are also interrelated. For example, De Novo projects are open-ended and exploratory, but their end product, a well-annotated reference sequence, is the foundation for Functional Genomics and Variation applications. Variation analysis is only useful if we can assign function to specific genotypes. Functional assignments come, in part, from previous experiments and genomic annotations, but are increasingly being produced by sequencing assays, so the new challenge is integrating that data obtained from different assays into coherent datasets that can link many attributes to a set of genotypes.
NGS clearly opens new possibilities for studying and characterizing biological systems. Different applications require different sequencing platforms, laboratory procedures, and software systems that can organize analysis tools and automate data processing. On this last point, as one evaluates their projects and their options for being successful, they need to identify informatics groups that have deep experience, available solutions, and strong capabilities to meet the next challenges. Geospiza is one such group.
Further Reading
DNA Sequencing History
Gilbert W, Maxam A (1973) The nucleotide sequence of the lac operator. Proc Natl Acad Sci U S A 70:3581
Maxam AM, Gilbert W (1977) A new method for sequencing DNA. Proc Natl Acad Sci U S A 74:560
Sanger F, Nicklen S, Coulson AR (1977) DNA sequencing with chain-terminating inhibitors. Proc Natl Acad Sci U S A 74:5463-7
Smith LM, Sanders JZ, Kaiser RJ, Hughes P, Dodd C, Connell CR, Heiner C, Kent SB, Hood LE (1986) Fluorescence detection in automated DNA sequence analysis. Nature 321:674-9
Adams MD, Soares MB, Kerlavage AR, Fields C, Venter JC (1993) Rapid cdna sequencing (expressed sequence tags) from a directionally cloned human infant brain cdna library. Nat Genet 4:373-80
International Human Genome Sequencing Consortium, 2001. “Initial sequencing and analysis of the human genome.” Nature 409, 860-921.

A brief history
DNA sequencing grew from our desire to understand how the instructions for the biochemistry of life are encoded in an organism’s DNA. If we know the precise ordering and organization of an organism’s DNA sequence, we can presumably unlock a code that reveals these instructions. Accomplishing this goal required the creation of a new field, molecular biology, and new technologies to sequence genes.
The first sequencing methods were arduous. They combined nuclease digestion with thin layer chromatography to measure di- and trinucleotides that could be puzzled together. Later, Maxim and Gilbert replaced enzymatic DNA degradation with a chemical fragmentation method that enabled the reading of ordered bases from 32P labeled fragments separated by electrophoresis.
The Sanger method, which used dideoxynucleotide triphosphates to create ensembles of DNA molecules terminated at each base, soon replaced Maxim Gilbert sequencing. The next innovation was to color code DNA with fluorescent dyes so that molecules could be interrogated with a laser and camera coupled to a computer. This innovation automated “high-throughput” DNA sequencing systems, initially with polyacrylamide gels and later with capillary electrophoresis, and made it possible to sequence the human and other genomes. It also created the first transcriptome analysis method, Expressed Tag Sequencing (EST).
Despite 20 years of advances, however, the high-throughput sequencing methods were not high-enough-throughput to realistically interrogate DNA and RNA molecules in creative ways. Big questions (genomes, ESTs, meta-genomes) required large factory-like approaches to automate sample preparation and collect sequences because a fundamental problem had yet to be solved. Specially, each sequence was obtained from an individual purified DNA clone or PCR product.
Real high-throughput is massively parallel throughput
The next-generation DNA sequencing (NGS) technologies free researchers from the need to clone or purify every molecule. They all share the common innovation that DNA sequencing is performed in a massively parallel format. That is a library, or ensemble of millions of DNA molecules, are simultaneously sequenced. Data collection costs are dramatically decreased through miniaturization and by eliminating the need for warehouses of colony pickers, prep robots, sequencing instruments, and large teams of people.
The new problem is dealing with the data that are produced and increasing computation costs. As NGS opens new possibilities to measure DNA and RNA in novel ways, each application requires a specific laboratory procedure that must be coupled to a specific analysis methodology.
Sequencing genealogy is defined by the questions
In an evolutionary model, the history of cloning, restriction site mapping, and Sanger sequencing form the trunk of the genomics application tree (top figure) from which branches develop as new applications emerge.
NGS has driven the evolution of three main sequencing branches: De Novo, Functional Genomics, and Variation Assays. The De Novo, or Exploratory, sequencing contains three subbranches that include new genomes (projects that seek to determine a complete genome sequence of an organism), meta-genomes (projects in which DNA fragments are sequenced from environmental samples), or meta-transcriptomes (projects where cDNA fragments are sequenced from environmental samples).

The Functional Genomics branch is growing fast. In these experiments, different collections of RNA or DNA molecules from an organism, tissue, or cells, are isolated and sequenced to measure gene expression and how it is regulated. Three subbranches describe the different kinds of function genomics: Expression, Regulation, and EpiGenomics, and each of these subbranches can be further divided into specific assay groups (DGE, RNA-Seq, small RNA, etc) that can be even further subdivided into specialized procedures (RNA-Seq with strandedness preserved) that are defined by laboratory protocols, kits, and instruments. When the experiments are refined and are made reproducible, they become assays.
Variation Assays form the third main branch of the tree. Genomic sequences are compared within and between populations to link genotype and phenotype. In special cases like cancer and immunology research, variation assays are used to observe changes within an organism’s somatic genomes over time. Today, variation, or resequencing, assays measure nucleotide and small insertions and deletions in whole genomes and exomes. If linked sequence strategies (mate-pairs, paired-ends) are used, larger structural changes including copy number variations can also be measured.

As a software provider with both deep lab and analysis experience, we [Geospiza] are often asked questions about what instrument platform is the best or how our software stacks up against other available options. The answer, of course, depends on what you want to do. De Novo applications benefit from long reads offered by platforms like 454. Many of the assay-based applications demand ultra-deep sequencing with very high numbers of sequences (reads) as provided by the short-read platforms (Illumina, SOLiD). New single molecule sequencing platforms like PacBio's are targeting a wide rage of applications but have best been demonstrated, thus far, for long-read uses and novel methylation assays.
From an informatics perspective, the exploratory and assay-based branches have distinct software requirements. Exploratory applications require that reads be assembled into contigs that must be further ordered into scaffolds to get to the complete sequence. In meta-genomics or meta-transcriptomics applications, data are assembled to obtain gene sequences. These projects are further complicated by orthologous and paralogous sequences and highly expressed genes that over represent certain sequences. In these situations, specialized hardware or complex data reduction strategies are needed to make assembly practical. Once data are assembled, they are functionally annotated in a second computational phase using tools like BLAST.
Assay-based data analysis also has two distinct phases, but they are significantly different from De Novo sequencing. The first phase involves aligning (or mapping) reads to reference data sources and then reducing the aligned data into quantitative values. At least one reference is required and the better it is annotated the more informative the initial results will be. Alignment differs from assembly in that reads are separately compared to a reference rather than amongst themselves. Alignment processing capacity can be easily scaled with multiple inexpensive computers whereas assembly processing cannot.
The second phase of Assay-based sequencing is to produce a discrete output as defined by a diagnostic application, or compare the quantitative values computed from the alignments from several samples, obtained from different individuals and (or) treatments relative to controls. This phase requires statistical tools to normalize data, filter false positives and negatives, and measure differences. Assay-based applications become more informative when large numbers of samples and replicates are included in a study.
Connecting the dots
While the sequencing applications can be grouped and summarized in different ways, they are also interrelated. For example, De Novo projects are open-ended and exploratory, but their end product, a well-annotated reference sequence, is the foundation for Functional Genomics and Variation applications. Variation analysis is only useful if we can assign function to specific genotypes. Functional assignments come, in part, from previous experiments and genomic annotations, but are increasingly being produced by sequencing assays, so the new challenge is integrating that data obtained from different assays into coherent datasets that can link many attributes to a set of genotypes.
NGS clearly opens new possibilities for studying and characterizing biological systems. Different applications require different sequencing platforms, laboratory procedures, and software systems that can organize analysis tools and automate data processing. On this last point, as one evaluates their projects and their options for being successful, they need to identify informatics groups that have deep experience, available solutions, and strong capabilities to meet the next challenges. Geospiza is one such group.
Further Reading
DNA Sequencing History
Gilbert W, Maxam A (1973) The nucleotide sequence of the lac operator. Proc Natl Acad Sci U S A 70:3581
Maxam AM, Gilbert W (1977) A new method for sequencing DNA. Proc Natl Acad Sci U S A 74:560
Sanger F, Nicklen S, Coulson AR (1977) DNA sequencing with chain-terminating inhibitors. Proc Natl Acad Sci U S A 74:5463-7
Smith LM, Sanders JZ, Kaiser RJ, Hughes P, Dodd C, Connell CR, Heiner C, Kent SB, Hood LE (1986) Fluorescence detection in automated DNA sequence analysis. Nature 321:674-9
Adams MD, Soares MB, Kerlavage AR, Fields C, Venter JC (1993) Rapid cdna sequencing (expressed sequence tags) from a directionally cloned human infant brain cdna library. Nat Genet 4:373-80
International Human Genome Sequencing Consortium, 2001. “Initial sequencing and analysis of the human genome.” Nature 409, 860-921.
Venter J.C., Adams M.D., Myers E.W., et. al. 2001. “The sequence of the human genome.” Science 291, 1304-1351.
FinchTalks
FinchTalks
Wednesday, September 22, 2010
Geospiza in the News
Our release that Eurofins MWG Operon has standardized their worldwide DNA sequencing operations on the GeneSifter LIMS is important for several reasons.
 Most significantly, as noted in the press release, we were chosen because of our deep support for both Sanger and Next Generation DNA sequencing (NGS). Our support for Sanger has been developed and improved on since 1997. No other LIMS product provides a comparable depth when it comes to understanding how Sanger sequencing (and fragment analysis) services are supported in the laboratory, or how Sanger data should be summarized in groups, by instruments, or runs to make quality control assessments and decisions. Finally, GeneSifter is the only Sanger-based product that allows sequence editing and tracks versions of those edits. This feature is made possible through integration with our popular FinchTV program that also provides a jumping off point for analyzing individual sequences with BLAST.

The news also points out that Sanger sequencing continues to play an important role in the DNA sequencing ecosystem. No other sequencing technology is suitable for doing a large number of small things. Thus, researchers access to Sanger systems will continue to play an important role in confirming clones, sequencing individual PCR products, and validating the results of NGS experiments. As many labs sunset their Sanger equipment in favor of NGS equipment, services such as those provided by Eurofins MWG Operon will continue to grow in importance, and we are thrilled to help.
Of course, the GeneSifter LIMS (GSLE) does much more than Sanger sequencing. Our NGS support is highly regarded, along with our microarray support as discussed in recent blogs announcing the current GSLE release and our recent news about PacBio.
Other product strengths include GSLE's configurability and application programming interfaces (APIs). Supporting worldwide deployment means non-english speakers within labs need to be able to communicate and use their words in forms and instructions. Using GSLE's standard web interfaces groups can internationalize parts of the system with their own language terms and comments to help their work. Finally, using GSLE's APIs Eurofins MWG Operon has easily incorporated the system into their web site to provide their customers with a smooth experience.
Saturday, September 11, 2010
The Interface Needs an Interface
A recent publication on Galaxy proposes that it is the missing graphical interface for genomics. Let’s find out.
The tag line of Michael Schatz’s article inGenome Biology states, “The Galaxy package empowers regular users to perform rich DNA sequence analysis through a much-needed and user-friendly graphical web interface.” I would take this description and Schatz’s later comment, “the ambitious goal of Galaxy is to empower regular users to carry out their own computational analysis without having to be an expert in computational biology or computer science” to mean that someone, like a biologist, who does not have much bioinformatics or computer experience could use the system to analyze data from a microarray or next gen sequencing experiment.
The Galaxy package is a software framework running bioinformatics programs and assembling those programs into complex pipelines referred to as workflows. It employs a web-interface and ships with a collection of tools to get a biologist quickly up and running, with examples. Given that Galaxy targets bioinformatics, it is reasonable to assume that its regular users are biologists. So, the appropriate question would be, how much does a biologist have to know about computers to use the system?
To test this question I decided to install the package. I have a Mac, and as a biologist, whether I’m on a Mac or PC, I expect that, if I’m given a download option, the software will easy to download and can be installed using a double click installer program. Galaxy does not have this. Instead, it uses a command line tool (oh, I need to use terminal) that requires Mercurial (hg). Hmm, what’s Mercurial? Mercurial is a version control system that supports distributed development projects. This not quite what I expected, but I’ll give it a try. I go to the hg (someone has a chemistry sense of humor) site and without too much trouble find a Mac OS X package, which uses a double click installer program. I’m in luck - of course I’ll ignore the you might have to add export LC_ALL=en_US.UTF-8, and export LANG=en_US.UTF-8 to your ~/.profile file - hg installs and works.
Now back to my terminal, I ignore the python version check and path setup commands, and type hg clone http://www.bx.psu.edu/hg/galaxy galaxy_dist; things happen. I follow the rest of the instructions - cd galaxy_dist; sh setup.sh - finally I start galaxy with the sh run.sh command. I go to my web browser and type http://localhost:8080 and galaxy is running! Kudos to the galaxy team for making a typically complicated process relatively simple. I’m also glad that I had none of the possible documented problems. However, to get this far, I had to tap into my unix experience.
 With Galaxy running, I can now see if Schatz’s claims stand up. What should I do? The left hand menu gives me a huge number of choices. There are 31 categories that organize input/output functions, file manipulation tools, graphing tools, statistical analysis tools, analysis tools, NGS tools, and SNP tools, perhaps 200 choices of things to do. I’ll start with something simple like displaying the quality values in an Illumina NGS file. To do this, I click on “upload file” under the get data menu. Wow! There are 56 choices of file formats - and 17 have explanations. Fortunately there is an auto-detect. I leave that option, go the choose file button to select an NGS file on my hard drive and load it in. I’ll ignore the comment that files greater than 2GB should be uploaded by an http/ftp URL, because I don’t know what they are talking about. Instead I’ll make a small test file with a few thousand reads. I’ll also ignore the URL/text box and choice to convert spaces to tabs and the genome menu that seems to have hundreds of genomes loaded as these options have nothing to do with a fastq file. I’ll assume “execute” means “save” and click it.
After clicking execute some activity appears in the right hand menu indicating that my file is being uploaded. After a few minutes, my NGS file is in the system. To look at quality information, I select the “NGS: QC and manipulation” menu to find a tool. There are 18 options for tools to split files, join files, convert files, and convert quality data in files; this stuff is complicated. Since all I want to do is start with creating some summary statics, I find and select "FASTQ summary statistics." This opens a page in the main window where I can select the file that I uploaded and click the execute button to generate a big 20 column table that contains one row per base in the reads. The columns contain information about the frequency of bases and statistical values derived from the quality values in the file. These data are displayed in a text table that is hard to read, so the next step is to graphically view the data in histogram and box plots.
Graphing tools are listed under a different menu, “Graph/Display Data.” I like box plots, so I’ll select that choice. In the main window I select my summary stats file, create a title for the plot, set the plot’s dimensions (in pixels), define x and y axes titles, and select the columns from the big table that contains the appropriate data. I click the execute button to create files containing the graphs. Oops, I get an error message. It says “/bin/sh gnuplot command not found.” I have to install gnuplot. To get gnuplot going I have to download source, compile the package, and install. To do this I will need developer tools installed along with gnuplot’s other dependencies for image drawing. This is getting to be more work than I bargained for ...
When Schatz said “regular user” he must have meant unix savvy biologist that understands bioinformatics terminology, file formats, and other conventions, and can install software from source code.
Alternatively, I can upload my data into GeneSifter, select the QC analysis pipeline, navigate to the file summary page, and click the view results link. After all, GeneSifter was designed by biologists for biologists.

The tag line of Michael Schatz’s article inGenome Biology states, “The Galaxy package empowers regular users to perform rich DNA sequence analysis through a much-needed and user-friendly graphical web interface.” I would take this description and Schatz’s later comment, “the ambitious goal of Galaxy is to empower regular users to carry out their own computational analysis without having to be an expert in computational biology or computer science” to mean that someone, like a biologist, who does not have much bioinformatics or computer experience could use the system to analyze data from a microarray or next gen sequencing experiment.
The Galaxy package is a software framework running bioinformatics programs and assembling those programs into complex pipelines referred to as workflows. It employs a web-interface and ships with a collection of tools to get a biologist quickly up and running, with examples. Given that Galaxy targets bioinformatics, it is reasonable to assume that its regular users are biologists. So, the appropriate question would be, how much does a biologist have to know about computers to use the system?
To test this question I decided to install the package. I have a Mac, and as a biologist, whether I’m on a Mac or PC, I expect that, if I’m given a download option, the software will easy to download and can be installed using a double click installer program. Galaxy does not have this. Instead, it uses a command line tool (oh, I need to use terminal) that requires Mercurial (hg). Hmm, what’s Mercurial? Mercurial is a version control system that supports distributed development projects. This not quite what I expected, but I’ll give it a try. I go to the hg (someone has a chemistry sense of humor) site and without too much trouble find a Mac OS X package, which uses a double click installer program. I’m in luck - of course I’ll ignore the you might have to add export LC_ALL=en_US.UTF-8, and export LANG=en_US.UTF-8 to your ~/.profile file - hg installs and works.
Now back to my terminal, I ignore the python version check and path setup commands, and type hg clone http://www.bx.psu.edu/hg/galaxy galaxy_dist; things happen. I follow the rest of the instructions - cd galaxy_dist; sh setup.sh - finally I start galaxy with the sh run.sh command. I go to my web browser and type http://localhost:8080 and galaxy is running! Kudos to the galaxy team for making a typically complicated process relatively simple. I’m also glad that I had none of the possible documented problems. However, to get this far, I had to tap into my unix experience.

After clicking execute some activity appears in the right hand menu indicating that my file is being uploaded. After a few minutes, my NGS file is in the system. To look at quality information, I select the “NGS: QC and manipulation” menu to find a tool. There are 18 options for tools to split files, join files, convert files, and convert quality data in files; this stuff is complicated. Since all I want to do is start with creating some summary statics, I find and select "FASTQ summary statistics." This opens a page in the main window where I can select the file that I uploaded and click the execute button to generate a big 20 column table that contains one row per base in the reads. The columns contain information about the frequency of bases and statistical values derived from the quality values in the file. These data are displayed in a text table that is hard to read, so the next step is to graphically view the data in histogram and box plots.
Graphing tools are listed under a different menu, “Graph/Display Data.” I like box plots, so I’ll select that choice. In the main window I select my summary stats file, create a title for the plot, set the plot’s dimensions (in pixels), define x and y axes titles, and select the columns from the big table that contains the appropriate data. I click the execute button to create files containing the graphs. Oops, I get an error message. It says “/bin/sh gnuplot command not found.” I have to install gnuplot. To get gnuplot going I have to download source, compile the package, and install. To do this I will need developer tools installed along with gnuplot’s other dependencies for image drawing. This is getting to be more work than I bargained for ...
When Schatz said “regular user” he must have meant unix savvy biologist that understands bioinformatics terminology, file formats, and other conventions, and can install software from source code.
Alternatively, I can upload my data into GeneSifter, select the QC analysis pipeline, navigate to the file summary page, and click the view results link. After all, GeneSifter was designed by biologists for biologists.

Thursday, September 2, 2010
Geospiza, SAIC, and PacBio
On Tue. 8/31, we release news about our collaboration with SAIC whereby we will enhance GeneSifter's support for the PacBio RS, Pacific Biosciences’ Single Molecule Real Time (SMRT™) sequencing system.
Geospiza is excited to work with the group at SAIC-Frederick. SAIC-Frederick is the operations and technical support contractor for the National Cancer Institute's research, so the effort will ultimately benefit researchers at NCI. Because several of our customers are part of PacBio's early access effort we will be able to get a broad view of PacBio RS platform's strengths and applications to support our many other customers who are interested in getting the system.
Most importantly, this news demonstrates our commitment to supporting all of the sequencing platforms. We already have great support for the Illumina GA and HiSeq, SOLiD, and 454. PacBio, IonTorrent can be supported through our configuration interfaces, and new releases will include specialized features to enhance our customers' experiences working with each instrument's unique qualities.
Look for announcements as new releases of GeneSifter Lab Edition and Analysis Edition roll out over the coming months. In the meantime, check out the full release including a nice quote from Eric Schadt, PacBio's CSO.
Friday, August 27, 2010
Sneak Peak: SOLiD RNA-Seq Data Analysis featuring Geospiza
Next Tue. Aug. 31, Life Technologies (LT) will host webinar featuring Geospiza. The abstract is posted below. To register, contact your LT rep.
SOLiD RNA-Seq Data Analysis featuring Geospiza
Presented by: Hugh Arnold, PhD.
Whole Transcriptome Analysis (WTA) allows researchers to assess the whole genome for coding as well as non-coding RNAs at an unprecedented level. In addition to allowing for the complete characterization of all known RNAs in a sample (gene level expression, exon usage, splice junction, single nucleotide variants, insertions and deletions), these applications are also ideal for the identification of novel RNAs as well as novel splicing events. In this talk we will present the capabilities of GeneSifter Analysis Edition (GSAE) in supporting researchers doing WTA on SOLiD™ sequencing platforms. Using data generated from paired-end SOLiD 4™ sequencing runs of Human Brain Reference and Universal Human Reference libraries, we will cover the analysis process used in GSAE for taking raw color space reads and getting to application specific results across multiple samples. More specifically, we will highlight the open-source, best analysis practices from published literature used in GSAE as well as discuss some of the challenges and solutions for WTA analysis. Lastly, we will review a suite of application specific tools available in GSAE that allow researchers to characterize and visualize differential transcript expression, differential splicing, and identify single nucleotide variants (SNVs) in a biologically meaningful context, across many whole transcriptomes.
Saturday, July 24, 2010
A Programmer's Perspective
There are many analogies describing the human genome as the program that runs a computer. Jim Stalker, the Senior Scientific Manager in charge of vertebrate resequencing informatics at the Sanger center eloquently described what that really means in his “Obligatory Tenuous Coding Analogy” during the Perl lightning talks at this year's OSCON conference.
Brilliant
I thank Jim for sharing his slides. Post a comment if you think you know the answer. Jim’s slides will be posted at the O’Reilly OSCON slide site.
The genome is the source of a program to build and run a human
But: the author is not available for comment
It’s 3GB in size
In a single line
Due to constant forking, there are about 7 billion different versions
It’s full of copy-and-paste and cruft
And it’s completely undocumented
Q: How do you debug it?
Brilliant
I thank Jim for sharing his slides. Post a comment if you think you know the answer. Jim’s slides will be posted at the O’Reilly OSCON slide site.
Wednesday, July 14, 2010
Increasing the Scale of Deep Sequencing Data Analysis with BioHDF
Last month, at the Department of Energy's Sequencing, Finishing and Analysis in the Future meeting, I presented Geospiza's product development work and how BioHDF is contributing to scalable infrastructures. The abstract, presentation, and link to the presentation are posted below.
Abstract
Next Generation DNA Sequencing (NGS) technologies are powerful tools for rapidly sequencing genomes and studying functional genomics. Presently, the value of NGS technology has been largely demonstrated on individual sample analyses. The full potential of NGS will be realized when it can be used in multisample experiments that involve different measurements and include replicates, and controls to make valid statistical comparisons. Arguably, improvements in current technology, and soon to be available “third” generation systems, will make it possible to simultaneously measure 100’s to1000’s of individual samples in single experiments to study transcription, alternative splicing, and how sequences vary between individuals and within expressed genes. However, several bioinformatics systems challenges must be overcome to effectively manage both the volumes of data being produced and the complexity of processing the numerous datasets that will be generated.
Future bioinformatics applications need to be developed on common standard infrastructures that can reduce overall data storage, increase data processing performance, integrate information from multiple sources and are self-describing. HDF technologies meet all of these requirements, have a long history, and are widely used in data-intensive science communities. They consist of general data file formats, software libraries and tools for manipulating the data. Compared to emerging standards such as the SAM/BAM formats, HDF5-based systems demonstrate improved I/O performance and improvedmethods to reduce data storage. HDF5 isalso more extensible and can support multiple data indexes and store multiple data types. For these reasons, HDF5 and its BioHDF implementation are well qualified as standards for implementing data models in binary formats to support the next generation of bioinformatics applications. Through this presentation we will demonstrate BioHDF's latest features in NGS applications that target transcription analysis and resequencing.
SciVee Video
Acknowledgments
1. Geospiza, Inc. 100 West Harrison N. Tower 330, Seattle WA 98119 2. Department of Physiology and Biophysics, Weil Cornell Medical College, 1305 York Ave., New York NY, 10021 3. The HDF Group, 1901 S. First St., Champaign IL 61820
Funding: NIH: STTR HG003792
Tuesday, June 29, 2010
GeneSifter Lab Edition 3.15
Last week we released GeneSifter Laboratory Edition (GSLE) 3.15. From NGS quality control data, to improved microarray support, to Sanger sequencing support, to core lab branding, and many others, there are a host of features and improvements for everyone that continue to make GSLE the leading LIMS for genetic analysis.
The three big features include QC Analysis of Next Generation Sequencing (NGS) Data and Microarrays, and core lab branding support.

Laboratory Operations
Several features and improvements introduced in 3.15 help prioritize steps, update items, improve ease of use, and enhance data handling.
Instrument Runs
More efficient views and navigation have been implemented for Orders and Invoices.
Several new system settings now enable GSLE to be more adaptable at customer sites.
Several additions to the self-documenting Application Programming Interface (API) have been made.
The three big features include QC Analysis of Next Generation Sequencing (NGS) Data and Microarrays, and core lab branding support.
- To better troubleshoot runs, and view data quality for individual samples in a multiplex, the data within fastq, fasta, or csfasta (and quality) files are used to generate quality report graphics (figure below). These include the overall base (color) composition, average, per base, quality values (QVs), box and whisker plots showing median, lower and upper quartile, and minimum and maximum QVs at each base position, and error analysis indicating the number of QVs below 10, 20 and 30. A link is also provided to conveniently view the sequence data in pages, so that GBs of data do not stream into your browser.
- For microarray labs, quality information from CHP and CEL files and a probe intensity data from CEL files are displayed. Please contact support@geospiza.com to activate of Affymetrix Settings and configure the CDF file path and power tools.
- For labs that use their own ordering systems, a GSLE data view page has been created that can be embedded in a core lab website. To support end user access, a new user role, Data Viewer, has been created to limit access to only view folders and data within the user's lab group. Please contact support@geospiza.com to activate the feature.
- The ability to create html tables in the Welcome Message for the Home page has been returned to provide additional message formatting capabilities.

Laboratory Operations
Several features and improvements introduced in 3.15 help prioritize steps, update items, improve ease of use, and enhance data handling.
Instrument Runs
- A time/date stamp has been added to the Instrument Run Details page to simplify observing when runs were completed.
- Partial Sanger (CE) runs can be manually completed (like NGS runs) instead of having to have all reactions be complete or fail the remaining.
- The NGS directory view of result files now provides deletion actions (by privileged users) so labs can more easily manage disk usage.
- Barcodes can be recycled or reused for templates that are archived to better support labs using multiple lots of 2D barcode tubes. However, the template barcode field remains unique for active templates.
- Run Ready Order Forms allow a default tag for the Plate Label to populate the auto-generated Instrument Run Name to make Sanger run set up quicker.
- The Upload Location Map action has been moved to the side menu bar under Lab Setup to ease navigation.
- The Template Workflows “Transition to the Next Workflow” action is now in English: “Enter Next Workflow.”
- All Sanger chromatogram download options are easier to see and now include the option to download .phd formatted files.
- The DNA template location field can be used to search for a reaction in a plate when creating a reaction plate.
- To redo a Sanger reaction with a different chemistry, the chemistry can now be changed when either Requeuing for Reacting is chosen, or Edit Reactions from within a Reaction Set is selected.
More efficient views and navigation have been implemented for Orders and Invoices.
- When Orders are completed, the total number of samples and the number of results can be compared on the Update Order Status page to help identify repeated reactions.
- A left-hand navigation link has been added for core lab customers to review both Submitted and Complete Invoices. The link is only active when invoicing is turned on in the settings.
Several new system settings now enable GSLE to be more adaptable at customer sites.
- The top header bar time zone display can be disabled or configured for a unique time zone to support labs with customers in different time zones.
- The User account profile can be configured to require certain fields. In addition, if Lab Group is not required, then Lab Groups are created automatically.
- Projects within GSLE can be inactivated by all user roles to hide data not being used.
Several additions to the self-documenting Application Programming Interface (API) have been made.
- An upload option for Charge Codes within the Invoice feature was added.
- Form API response objects are now more consistent.
- API keys for user accounts can be generated in bulk.
- Primers can be identified by either label or ID.
- Events have been added. Events provide a mechanism to call scripts or send emails (beyond the current defaults) when system objects undergo workflow changes.
Friday, June 11, 2010
Levels of Quality
Next Generation Sequencing (NGS) data can produce more questions than answers. A recent LinkedIn discussion thread began with a simple question. “I would like to know how to obtain statistical analysis of data in a fastq file? number of High quality reads, "bad" reads....” This simple question opened a conversation about quality values, read mapping, and assembly. Obviously there is more to NGS data quality than simply separating bad reads from good ones.
Different levels of quality
Before we can understand data quality we need to understand what sequencing experiments measure and how the data are collected. In addition to sequencing genomes, many NGS experiments focus on measuring gene function and regulation by sequencing the fragments of DNA and RNA isolated and prepared in different ways. In these assays, complex laboratory procedures are followed to create specialized DNA libraries that are then sequenced in a massively parallel format.
 Once the data are collected, they need to be analyzed in both common and specialized ways as defined by the particular application. The first step (primary analysis) converts image data, produced by different platforms into sequence data (reads). This step, specific to each sequencing platform, also produces a series of quality values (QVs), one value per base in a read, that define a probability that the base is correct. Next (secondary analysis), the reads and bases are aligned to known reference sequences, or, in the case of de novo sequencing, the data are assembled into contiguous units from which a consensus sequence is determined. The final steps (tertiary analysis) involve comparing alignments between samples or searching databases to get scientific meaning from the data.
Quality Value Analysis
 Examples of useful counting statistics include measuring average QVs by base position, box and whisker (BW) plots, histogram plots of QV thresholds, and overall QV distributions. Average QVs by base, BW plots, and QV thresholds are used to see how QVs trend across the reads. In most cases, these plots show the general trend that data quality decreases toward the 3’ ends of reads. Average QVs by base show each base’s QV with error bars indicating the values that are within one standard deviation of the mean. BW plots provide additional detail to show the minimum and maximum QV, the median QV and the lower and upper quartile QV values for each base. Histogram plots of QV thresholds count the number of bases below threshold QVs (10, 20, 30). This methods provides information about potential errors in the data and its utility in applications like RNA-seq or genotyping. Finally distributions of all QVs or the average QV per read can give additional indications of dataset quality.
QV analysis primarily measures sequencing and instrument run quality. For example, sharp drop offs in average QVs can identify systematic issues related to the sequencing reactions. Comparing data between lanes or chambers within a flowcell can flag problems with reagent flow or imaging issues within the instrument. In more detailed analyses, the coordinate positions for each read can be used to reconstruct quality patterns for very small regions (tiles) within a slide to reveal subtle features about the instrument run.
Sequence Characteristics
In addition to QV analysis we can look the sequences of the reads to get additional information. If we simply count the numbers of A’s, C’s, G’s, or T’s (or color values), at each base position, we can observe sequence biases in our dataset. Adaptor sequences, for example, will show sharp spikes in the data, whereas random sequences will give us an even distribution, or bias that reflects the GC content of the organism being analyzed. Single stranded data will often show a separation of the individual base lines; double stranded coverage should have equal numbers of AT and GC bases.
 We can also compare each read to the other reads in the dataset to estimate the overall randomness, or complexity, of our data. Depending on the application, a low complexity dataset, one with a high number of exactly matching reads, can indicate PCR biases or a large number of repeats in the case of de novo sequencing. In other cases, like tag profiling assays, which measure gene expression by sequencing a small fragment from each gene, low complexity data are normal because highly expressed genes will contribute a large number of identical sequences.
Alignment Information
Additional sample and data quality can be measured after secondary analysis. Once the reads are aligned (mapped) to reference data sources we can ask questions that reflect both run and sample quality. The overall number of reads that can be aligned to all sources can also be used to estimate parameters related to library preparation and deposition of the molecules on the beads or slides used for sequencing. Current NGS processes are based on probabilistic methods for separating DNA molecules. Illumina, SOLiD, and 454 all differ with respect to their separation methods, but share the common feature that the highest data yield occurs when concentration of DNA is just right. The number of mappable reads can measure this property.
 DNA concentration measures one aspect of sample quality. Examining which reference sources reads align to gives further information. For example, the goal of transcriptome analysis is to sequence non-ribosomal RNA (rRNA). Unfortunately rRNA is the most abundant RNA in a cell. Hence transcriptome assays involve steps to remove rRNA and a large number of rRNA reads in the data indicates problems with the preparation. In exome sequencing or other methods where certain DNA fragments are enriched, the ratio of exon (enriched) and non-exon (non-enriched) alignments can reveal how well the purification worked.
So Many Questions
The above examples provide a short tour of how NGS data can be analyzed to measure the quality of samples, experiments, protocol and instrument performances. NGS assays are complex and involve multistep lab procedures and data analysis pipelines that are specific to different kinds of applications. Sequence bases and their quality values provide information about instrument runs and some insights into samples and preparation quality. Additional, information are obtained after the data are aligned to multiple reference data sources. Data quality analysis is most useful when values are computed shortly after data are collected, and systems, like GeneSifter Lab and Analysis Editions, that automate these analyses are important investments if labs plan to be successful with their NGS experiments.
Different levels of quality
Before we can understand data quality we need to understand what sequencing experiments measure and how the data are collected. In addition to sequencing genomes, many NGS experiments focus on measuring gene function and regulation by sequencing the fragments of DNA and RNA isolated and prepared in different ways. In these assays, complex laboratory procedures are followed to create specialized DNA libraries that are then sequenced in a massively parallel format.

In each step of the analysis process, the data and information produced can be further analyzed to get multiple levels of quality information that reflect how well instruments performed, if processes worked, or whether samples were pure. We can group quality analyses into three general levels: QV analysis, sequence characteristics, and alignment information.
Quality Value Analysis
Many of the data quality control (QC) methods are derived from Sanger sequencing where QVs could be used to identify low quality regions that could indicate mixtures of molecules or define areas that should be removed before analysis. QV correlations with base composition could also be used to sort out systematic biases, like high GC content, that affect data quality. Unlike Sanger sequencing, where data in a trace represent an average of signals produced by ensemble of molecules, NGS provides single data points collected from individual molecules arrayed on a surface. NGS QV analysis uses counting statistics to summarize the individual values collected from the several million reads produced by each experiment.

QV analysis primarily measures sequencing and instrument run quality. For example, sharp drop offs in average QVs can identify systematic issues related to the sequencing reactions. Comparing data between lanes or chambers within a flowcell can flag problems with reagent flow or imaging issues within the instrument. In more detailed analyses, the coordinate positions for each read can be used to reconstruct quality patterns for very small regions (tiles) within a slide to reveal subtle features about the instrument run.
Sequence Characteristics
In addition to QV analysis we can look the sequences of the reads to get additional information. If we simply count the numbers of A’s, C’s, G’s, or T’s (or color values), at each base position, we can observe sequence biases in our dataset. Adaptor sequences, for example, will show sharp spikes in the data, whereas random sequences will give us an even distribution, or bias that reflects the GC content of the organism being analyzed. Single stranded data will often show a separation of the individual base lines; double stranded coverage should have equal numbers of AT and GC bases.

Alignment Information
Additional sample and data quality can be measured after secondary analysis. Once the reads are aligned (mapped) to reference data sources we can ask questions that reflect both run and sample quality. The overall number of reads that can be aligned to all sources can also be used to estimate parameters related to library preparation and deposition of the molecules on the beads or slides used for sequencing. Current NGS processes are based on probabilistic methods for separating DNA molecules. Illumina, SOLiD, and 454 all differ with respect to their separation methods, but share the common feature that the highest data yield occurs when concentration of DNA is just right. The number of mappable reads can measure this property.

Read mapping, however, is not a complete way to measure data quality. High quality reads that do not match any reference data in the analysis pipeline could be from unknown laboratory contaminants, sequences like novel viruses or phage, or incomplete reference data. Unfortunately, the former case is the more common, so it is a good idea to include reference data for all ongoing projects in the analysis pipeline. Alignments to adaptor sequences can reveal issues related to preparation processes and PCR, and the positions of alignments can be used to measure DNA or RNA fragment lengths.
So Many Questions
The above examples provide a short tour of how NGS data can be analyzed to measure the quality of samples, experiments, protocol and instrument performances. NGS assays are complex and involve multistep lab procedures and data analysis pipelines that are specific to different kinds of applications. Sequence bases and their quality values provide information about instrument runs and some insights into samples and preparation quality. Additional, information are obtained after the data are aligned to multiple reference data sources. Data quality analysis is most useful when values are computed shortly after data are collected, and systems, like GeneSifter Lab and Analysis Editions, that automate these analyses are important investments if labs plan to be successful with their NGS experiments.
Friday, May 21, 2010
I Want My FinchTV*
Without a doubt FinchTV is a wildly successful sequence trace viewer. Since it’s launch, close to 150,000 researchers and students have enjoyed its easy to use interface, cross platform capabilities, and unique features. But, where does it go from here?
Time for Version 2

FinchTV is Geospiza's free DNA sequence trace viewer that is used on Macintosh, Windows, and Linux computers to open and view DNA sequence data from Sanger-based instruments. It reads both AB1 and SCF files and displays the DNA sequence and four color traces of the corresponding electropherogram. When quality values are present, they are displayed with the data. Files can be opened with a simple drag and drop action, and once opened, traces can be viewed in a either a single pane or multi-pane full sequence format. Sequences can be searched using regular expressions, edited, and regions selected and used to launch NCBI BLAST searches.

 Over the past years we have learned that FinchTV is used in many kinds of environments suchas research labs, biotechnology and pharmaceutical companies, and educational settings. In some labs, it is the only tool people use to work with their data. We’ve also collected a large number of feature requests that include viewing protein translations, performing simple alignments, working with multiple sequences, changing the colors of the electropherogram tracings, and many others.
Free software is not built from free development
FinchTV was originally developed under an SBIR grant as a prototype for cross platform software development. Until then, commercial quality trace viewers ran on either Windows or Macintosh, never both. Cross platform viewers were crippled versions of commercial programs, and none of the programs incorporated modern GUI (graphical user interface) features and were cumbersome to use.
FinchTV is a high quality, full featured, free program; we want to improve the current version and keep it free. So, the question becomes how to keep a free product up to date?
One way is through grant funding. Geospiza believes a strong case can be made to develop a new version of FinchTV under an SBIR grant because we know Sanger sequencing is still very active. From the press coverage, one would think next generation DNA sequencing (NGS) is going to be the way all sequencing will soon be done. True there are many projects where Sanger is no longer appropriate, but NGS cannot do small things, like confirm clones. Sanger sequencing also continues to grow in the classroom, hence tools like FinchTV are great as education resources.
One way is through grant funding. Geospiza believes a strong case can be made to develop a new version of FinchTV under an SBIR grant because we know Sanger sequencing is still very active. From the press coverage, one would think next generation DNA sequencing (NGS) is going to be the way all sequencing will soon be done. True there are many projects where Sanger is no longer appropriate, but NGS cannot do small things, like confirm clones. Sanger sequencing also continues to grow in the classroom, hence tools like FinchTV are great as education resources.
We think there are more uses too, so we’d like to hear your stories.
How do you use FinchTV?
What would you like FinchTV to do?
Send us a note (info at geospiza.com) or, even better, add a comment below. We plan to submit the proposal in early August and look forward to hearing your ideas.
* apologies to Dire Straights "Money for Nothing"
Monday, May 17, 2010
Journal Club: GeneSifter Aids Stem Cell Research
Last week’s Nature featured an article entitled “Aberrant silencing of imprinted genes on chromosome 12qF1 in mouse induced pluripotent stem cells [1]” in which GeneSifter Analysis Edition (GSAE) was used to compare gene expression between genetically identical mouse embryonic stem (ES) cells and induced pluripotent stem cells (iPSCs).
Stem Cells

GeneSifter in Action
Comparing genetically similar cells requires that both ES cells and iPSCs have the same transgenes. To accomplish this goal, Stadtfeld and coworkers devised a clever strategy whereby they created a novel inducible transgene cassette and introduced it into mouse ES cells. The modified ES cells were then used to generate cloned mice containing the inducible gene cassette in all of their cells. Somatic cells could be converted to iPSCs by adding the appropriate inducing agents to the tissue culture media.
1. Stadtfeld M., Apostolou E., Akutsu H., Fukuda A., Follett P., Natesan S., Kono T., Shioda T., Hochedlinger K., 2010. "Aberrant silencing of imprinted genes on chromosome 12qF1 in mouse induced pluripotent stem cells." Nature 465, 175-181.
2. Takahashi K., Yamanaka S., 2006. "Induction of pluripotent stem cells from mouse embryonic and adult fibroblast cultures by defined factors." Cell 126, 663-676.
Stem Cells
Stems cells are undifferentiated, pluripotent, cells that later develop into the specialized cells of tissues and organs. Pluripotent cells can divide essentially without limit, become any kind of cell, and have been found to naturally repair certain tissues. They are the focus of research because of their potential for treating diseases that damage tissues. Initially stem cells were isolated from embryonic tissues. However, with human cells, this approach is controversial. In 2006 researchers developed ways to “reprogram” somatic cells to become pluripotent cells [2]. In addition to being less controversial, iPSCs have other advantages, but there are open questions as to their therapeutic safety due to potential artifacts introduced during the reprogramming process.
Reprogramming cells to become iPSCs involves the overexpression of a select set of transcription factors by viral transfection, DNA transformation, and other methods. To better understand what happens during reprogramming, researchers have examined gene expression and DNA methylation patterns between ES cells and iPSCs and have noted major differences in mRNA and microRNA expression as well as DNA methylation patterns. As noted in the paper, a problem with previous studies is that they compared cells with different genetic backgrounds. That is, the iPSCs harbor viral transgenes that are not present in the ES cells, and the observed differences could likely be due to factors unrelated to reprogramming. Thus, a goal of this paper's research was to compare genetically identical cells to pinpoint the exact mechanisms of reprogramming.
GeneSifter in Action
Comparing genetically similar cells requires that both ES cells and iPSCs have the same transgenes. To accomplish this goal, Stadtfeld and coworkers devised a clever strategy whereby they created a novel inducible transgene cassette and introduced it into mouse ES cells. The modified ES cells were then used to generate cloned mice containing the inducible gene cassette in all of their cells. Somatic cells could be converted to iPSCs by adding the appropriate inducing agents to the tissue culture media.
Even though ES cells and iPSCs were genetically identical, ES cells were able to generate live mice whereas iPSCs could not. To understand why, the team looked at gene expression using microarrays. The mRNA profiles for six iPSC and four ES cell replicates were analyzed in GeneSifter. Unsupervised clustering showed that global gene expression was similar for all cells. When the iPSC and ES cell data were compared using correlation analysis, the scatter plot identified two differentially expressed transcripts corresponding to a non-coding RNA (Gtl2) and small nucleolar RNA (Rian). The transcripts’ genes map to the imprinted Dlk1-Dio3 gene cluster on mouse chromosome 12qF1. While these genes were strongly repressed in iPSC clones, the expression of housekeeping and pluripotentency cells was unaffected as demonstrated using GeneSifter’s expression heat maps.
Subsequent experiments that looked at gene expression from over 60 iPSC lines produced from different types of cells and chimeric mice that were produced from mixtures of iPSCs and stem cells showed that the gene silenced iPSCs had limited development potential. Because the Dlk3-Dio cluster imprinting is regulated by methylation, methylation patterns revealed that the Gtl2 allele had acquired an aberrant silent state in the iPSC clones. Finally, by knowing that Dlk3-Dio cluster imprinting is also regulated by histone acetylation, the authors were able to treat their iPSCs with a histone deacetylase inhibitor and produce live animals from the iPSCs. Producing live animals from iPSCs in a significant milestone for the field.
While histone deacetylase inhibitors have multiple effects, and more work will need to be done, the authors have completed a tour de force of work in this exciting field, and we are thrilled that our software could assist in this important study.
Further Reading
2. Takahashi K., Yamanaka S., 2006. "Induction of pluripotent stem cells from mouse embryonic and adult fibroblast cultures by defined factors." Cell 126, 663-676.
Stem Cell Basics: http://stemcells.nih.gov/info/basics
iPSCs: http://en.wikipedia.org/wiki/IPS_cells
iPSCs: http://en.wikipedia.org/wiki/IPS_cells
Tuesday, May 11, 2010
Journal Club: Decoding Biology
DNA sequences hold the information needed to create proteins and regulate their abundance. Genomics research focuses on deciphering the codes that control these processes by combining DNA sequences with data form assays that measure gene expression and protein interactions. The codes are deciphered when specific sequence elements (motifs) are identified and can be later used to predict outcomes. The recent Nature article “Deciphering the Splicing Code,” begins to reveal the codes of alternative splicing.
The genetic codes
 Since the discovery that DNA is a duplex molecule [1] which stores and replicates the information of living systems, the goal of modern biology has been to understand how the blueprint of a living system is encoded in its DNA. The first quest was to learn how DNA's four letter nucleotide code was translated into the 20 letter amino acid code of proteins. Experiments conducted in the 1960’s revealed that different combinations of triplet DNA bases encoded specific amino acids to produce the “universal” genetic code, which is nearly identical in all species that have been examined to date [2].
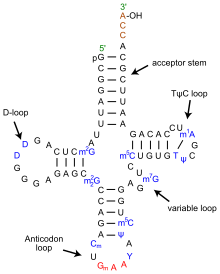 Translating mRNA into protein is a complex process, however, that involves many proteins and ribosomal RNA (rRNA) collectively organized in ribosomes. As the ribosomes read the mRNA sequence, transfer RNA (tRNA) molecules bring individual amino acids to the ribosome where they are added to a growing polypeptide chain. The universal genetic code explained how tri-nucleotide sequences specified amino acids. It could also be used to elucidate the anti-codon portion of tRNA [3], but it could not explain how the correct amino acid was added to the tRNA. For that another genetic code needed to be cracked. In this code, first proposed in 1988 [4], multiple sequences, including the anti-codon loop, within each tRNA molecule are recognized by a matched enzyme that combines an amino acid with its appropriate tRNA.
Codes to create diversity
The above codes are involved with the process of translating genetic sequences into protein. Most eukaryotic genes, and a few prokaryotic genes, cannot be translated in a continuous way because the protein coding regions (exons) are interrupted by non-coding regions (introns). When DNA is first transcribed into RNA, all regions are included and the introns must be excised to form the final messenger RNA (mRNA). This process makes it possible to create many different proteins from a single gene through alternative splicing in which exons are either differentially removed or portions of exons are joined together. Alternative splicing occurs in development and tissue specific ways; many disease causing mutations disrupt splicing patterns. So, understanding the codes that control splicing is an important research topic.
Some of the splicing codes, such as the exon boundaries, are well known, and others are not. In “Deciphering the Splicing Code,” Barash and colleagues looked at thousands of alternatively spliced exons - and surrounding intron sequences - from 27 mouse tissues to unravel over 1000 sequence features that could define a new genetic code. Their goal is build catalogs of motifs that could be used to predict splicing patterns of uncharacterized exons and determine how mutations might affect splicing.
 Using data from existing microarray experiments, RNA sequence features compiled from the literature, and other known attributes of RNA structure, Barash and co-workers developed computer models to determine which combinations of features best correlated with experimental observations. The resulting computer program provided tissue specific splicing predictions of whether an exon would be included or excluded based on its surrounding motif sequences and tissue type with reasonable success. More importantly, the program could be used to identify interaction networks that identified pairs of motifs that were frequently observed together.
2. http://en.wikipedia.org/wiki/Genetic_code
3. http://nobelprize.org/nobel_prizes/medicine/laureates/1968/holley-lecture.pdf
4. Hou YM, Schimmel P (1988) "A simple structural feature is a major determinant of the identity of a transfer RNA." Nature 333:140-5.
The genetic codes
 Since the discovery that DNA is a duplex molecule [1] which stores and replicates the information of living systems, the goal of modern biology has been to understand how the blueprint of a living system is encoded in its DNA. The first quest was to learn how DNA's four letter nucleotide code was translated into the 20 letter amino acid code of proteins. Experiments conducted in the 1960’s revealed that different combinations of triplet DNA bases encoded specific amino acids to produce the “universal” genetic code, which is nearly identical in all species that have been examined to date [2].
 Codes to create diversity
The above codes are involved with the process of translating genetic sequences into protein. Most eukaryotic genes, and a few prokaryotic genes, cannot be translated in a continuous way because the protein coding regions (exons) are interrupted by non-coding regions (introns). When DNA is first transcribed into RNA, all regions are included and the introns must be excised to form the final messenger RNA (mRNA). This process makes it possible to create many different proteins from a single gene through alternative splicing in which exons are either differentially removed or portions of exons are joined together. Alternative splicing occurs in development and tissue specific ways; many disease causing mutations disrupt splicing patterns. So, understanding the codes that control splicing is an important research topic.
Some of the splicing codes, such as the exon boundaries, are well known, and others are not. In “Deciphering the Splicing Code,” Barash and colleagues looked at thousands of alternatively spliced exons - and surrounding intron sequences - from 27 mouse tissues to unravel over 1000 sequence features that could define a new genetic code. Their goal is build catalogs of motifs that could be used to predict splicing patterns of uncharacterized exons and determine how mutations might affect splicing.
Predicting alternative splicing is at an early stage, but as pointed out be the editorial summary, the approach of Barash and co-workers will be improved by the massive amounts of data being generated by new sequencing technologies and applications like RNA-Seq and various protein binding assays. The real test will be expanding the models to new tissues and human genomics. In the meantime, if you want to test their models on some of your data or explore new regulatory elements, the Frey lab has developed a web tool that can be accessed at http://genes.toronto.edu/wasp/.
I’m done with seconds, can I have a third?
As an aside, the authors of the editorial summary coined the work as the second genetic code. I find this amusing, because this would be the third second genetic code. The aminoacyl tRNA code was also coined the second genetic code, but people must have forgotten that, because another second genetic code was proposed in 2001. This genetic code describes how methylated DNA sequences regulate chromatin structure and gene regulation. Rather than have a third second genetic code, maybe we should refer to this as the third genetic code or the next generation code.
Further Reading
1. Watson JD, and Crick F (1953). "A structure for deoxyribose nucleic acid". Nature 171: 737–8.
2. http://en.wikipedia.org/wiki/Genetic_code
3. http://nobelprize.org/nobel_prizes/medicine/laureates/1968/holley-lecture.pdf
4. Hou YM, Schimmel P (1988) "A simple structural feature is a major determinant of the identity of a transfer RNA." Nature 333:140-5.
Thursday, April 22, 2010
Bloginar: RNA Deep Sequencing: Beyond Proof of Concept
RNA-Seq is a powerful method for measuring gene expression because you can use the deep sequence data to measure transcript abundance and also determine how transcripts are spliced and whether alleles of genes are expressed differentially.
At this year’s ABRF (Association for Biomedical Research Facilities) conference, we presented a poster, using data from published study, to demonstrate how GeneSifter Analysis Edition (GSAE) can be used in next generation DNA sequencing (NGS) assays that seek to compare gene expression and alternative splicing between different tissues, conditions, or species.
The following map guides the presentation. The poster has a title and four main sections, which cover background information, introduction to the published work and data, ways to observe alternative splicing and global gene expression differences between samples, and ways to observe sex specific gene expression differences. The last section also identifies a mistake made by the authors.
The following map guides the presentation. The poster has a title and four main sections, which cover background information, introduction to the published work and data, ways to observe alternative splicing and global gene expression differences between samples, and ways to observe sex specific gene expression differences. The last section also identifies a mistake made by the authors.


Section 1. The first section begins with the abstract and lists five specific challenges created by NGS: 1) high end computing infrastructures are needed to work with NGS data, 2) NGS data analysis involves complex multistep processes, 3) NGS data need to be compared to many reference databases, 4) the resulting datasets of alignments must be visualized in different ways, and 5) scientific knowledge is gained when several aligned datasets are compared.
Next, we are reminded that NGS data are analyzed in three phases: primary analysis, secondary analysis and tertiary analysis. Primary analysis is the step that converts images to reads consisting of basecalls (or colors, or flowgrams), and quality values. In secondary analysis, reads are aligned to reference data (mapped) or amongst themselves (assembled). Secondary analysis produces tables of alignments that must be compared to one and other, in tertiary analysis, to gain scientific insights.
Finally, GSAE is introduced as a platform for scalable data analysis. GSAE’s key features and advantages are listed along with several screen shots to show the many ways in which analyzed data can be presented to gain scientific insights.

Section 2 introduces the RNA-Seq data used for the presentation. These data, from a study that set out to measure sex and lineage specific alternative splicing in primates [1], were obtained from the Gene Expression Omnibus (GEO) database at NCBI, transferred into GSAE, and processed through GSAE’s RNA-Seq analysis pipelines. We chose this study because it models a proper expression analysis using replicated samples to compare different cases.
All steps of the process, from loading the data to processing the files and viewing results were executed through GSAE’s web-based interfaces. The four general steps of the process are outlined in the box labeled “Steps.”
The section ends with screen shots from GSAE showing how the primary data can be viewed and a list of the reports showing different alignment results for each sample in the list. The reports are accessed from a “Navigation Panel” that contains links to Alignment Summaries, a Filter Report, and a Searchable Sortable Gene List (shown), and several other reports (not shown).
The Alignment Summary provides information about the numbers of reads mapping to different reference data sources that are used in the analysis to understand sample quality and study biology. For example, in RNA-Seq, it is important to measure and filter reads matching ribosomal RNA (rRNA) because the amount of rRNA present indicates how well clean up procedures work. Similarly, the number of reads matching adaptors indicates how well the library was prepared. Biological, or discovery based, filters include reads matching novel exon junctions and intergenic regions of the genome.
Other reports like the Filter Report and Gene List provide additional detail. The Filter Report clusters alignments and plots base coverage (read density) across genomic regions. Some regions, like mitochondrial DNA, and rRNA genes, or transcripts, are annotated. Others are not. These regions can be used to identify areas of novel transcription activity.
The Gene List provides the most detail and gives a comprehensive overview of the number of reads matching a gene, numbers of normalized reads, and the counts of novel splices, single nucleotide variants (SNVs), and small insertions and deletions (indels). Read densities are plotted as small graphs to reveal each gene’s exon/intron structure. Additional columns provide the gene’s name, chromosome, and contain links to further details in Entrez. The graphs are linked to the Integrated Gene Viewer to explore the data further. Finally, the Gene LIst is an interactive report that can searched, sorted, and filtered in different ways, so you can easily view the details of your gene or chromosome of interest.

Section 3 shows how GSAE can be used to measure global gene expression and examine the details for a gene that is differentially expressed between samples. In the case of RNA-Seq, or exon arrays, relative exon levels can be measured to observe genes that are spliced differently between samples. The presented example focuses on the arginosuccinate synthetase 1 (ASS1) gene and compares the expression levels of its transcripts and exons between the six replicated human and primate male samples.
The Gene Summary report shows that ASS1 is down regulated by 1.38 times in the human samples. More interestingly, the exon usage plot shows that this gene is differentially spliced between the species. Read alignment data, supporting this observation, are viewed by clicking the “View Exon Data” link that is below the Exon Usage heat map. This link brings up the Integrated Gene Viewer (IGV) for all six samples. In addition to showing read densities across the gene, IGV also shows the numbers of reads that span exon junctions as loops with heights proportional to the number of reads mapping to a given junction. In these plots we see that the human samples are missing the second exon whereas the primate samples show two forms of the transcript. IGV also includes the Entrez annotations and known isoforms for the gene and the positions of known SNPs from dbSNP. And, IGV is interactive; controls at the top of the report and regions within the gene map windows are used to navigate to new locations and zoom in or out of the data presented. When multiple genes are compared, the data are updated for all genes simultaneously.
Section 3 closes with heat map representing global gene expression for the samples being compared. Expression data are clustered using a 2-way ANOVA with 5% false discovery filter (FDR). The top half of the hierarchical cluster groups genes that are down regulated in humans and up regulated in primates and the bottom half groups genes that are expressed in the opposite fashion. The differentially expressed genes can also be viewed in Pathway Reports which show how many genes are up or down regulated in a particular Gene Ontology (GO) pathway. Links in these reports navigate to lists of the individual genes or their KEGG pathways. When a KEGG pathway is displayed, the genes that are differentially expressed are highlighted.

Section 4 focuses on the sex specific differences in gene expression between the human and primate samples. In this example, 12 samples are being compared: three replicates for the male and female samples of two species. When these data were reanalyzed in GSAE, we were able to note that an obvious mistake. By examining Y chromosome gene expression, it was clear that one of the human male samples (M2-2) was lacking expression of these genes. Similarly, when the X (inactive)-specific transcript (XIST) was examined, M2-2 showed high expression like the other female samples. The simplest explanations for these observations are that either M2-2 is a female, or a dataset was copied and mislabeled in GEO. However, given that the 12 datasets show subtle differences, it is likely that they are all different and the first explanation is more likely.
The poster closes with a sidebar showing how GSAE can be used to measure global sequence variation and the take home points for the presentation. The most significant being that if the authors of the paper had used a system like GSAE, they could have quickly observed the problems in their data that we saw and prevented a mistake.
To see how you can use GSAE for your data sign up for a trial.
1. Sex-specific and lineage-specific alternative splicing in primates. Blekhman R, Marioni JC, Zumbo P, Stephens M, Gilad Y,. Genome Res. published online December 15, 2009
Subscribe to:
Posts (Atom)